Showcase Achievements with Numbered Progress Bars
Product Description
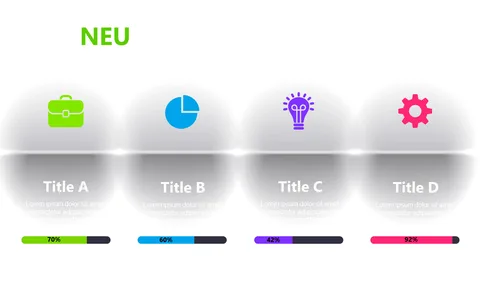
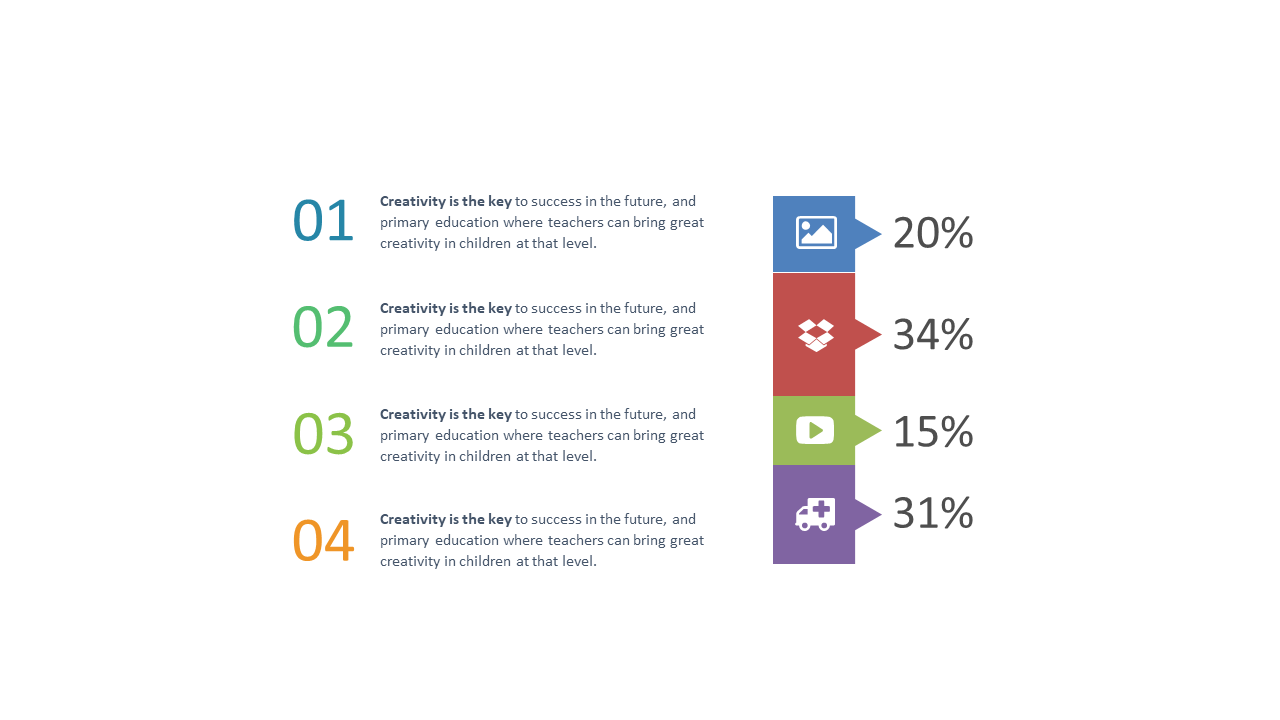
Presenting operational data in an understandable way is essential, especially when you’re under pressure to showcase achievements. This slide provides a straightforward layout with numbered progress bars that effectively communicate your key metrics, making it easier for your audience to grasp your accomplishments at a glance.
Operations managers and project leads will find this slide useful during performance reviews or team updates, where clear data presentation is critical. It helps in highlighting milestones and progress in a visually compelling way, ensuring your message resonates with your audience.
For only $0.99, you can download this slide instantly and edit it to fit your style in PowerPoint or Google Slides. You’ll be equipped to present your data clearly and professionally in just a few minutes.
$0.99 – Purchase Checkout
Added to cart