Showcase Concept Overlaps with Venn Diagram V2

Product Description
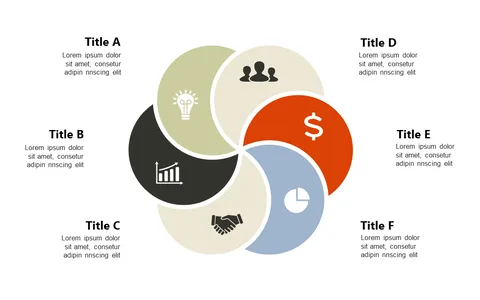
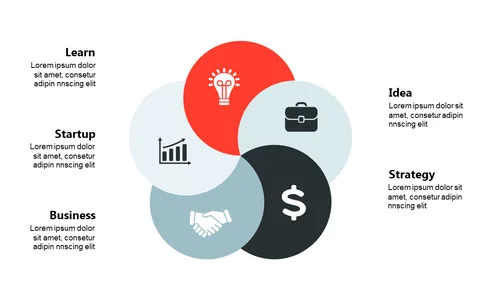
Conveying complex relationships among concepts can often lead to confusion. With the Venn diagram slide, you can present overlapping ideas with precision and clarity, ensuring your audience stays engaged and informed.
Performance managers, for example, will find this slide invaluable during team meetings or project updates, where illustrating the connections between different performance metrics is crucial. It’s equally useful for product development teams analyzing user feedback and feature overlaps.
At only $0.99, this slide is available for instant download. You’ll find it easy to edit in both PowerPoint and Google Slides, enabling you to customize it quickly for your next presentation.
$0.99 – Purchase Checkout
Added to cart
✅ Instant delivery
✅ Fully editable
✅ PowerPoint & Google Slides
Category:
$0.99
Per slide · No minimum · Pay only for what you pick
✓ $0.99/slide
No minimum order
✓ Mix any category
No subscription
Building a full deck?
Mix slides from any of our 58 categories —
all merged into one PowerPoint.
$0.99/slide, no minimum.
Browse All Slides →