Visualize Performance with Circular Progress Indicators
Product Description
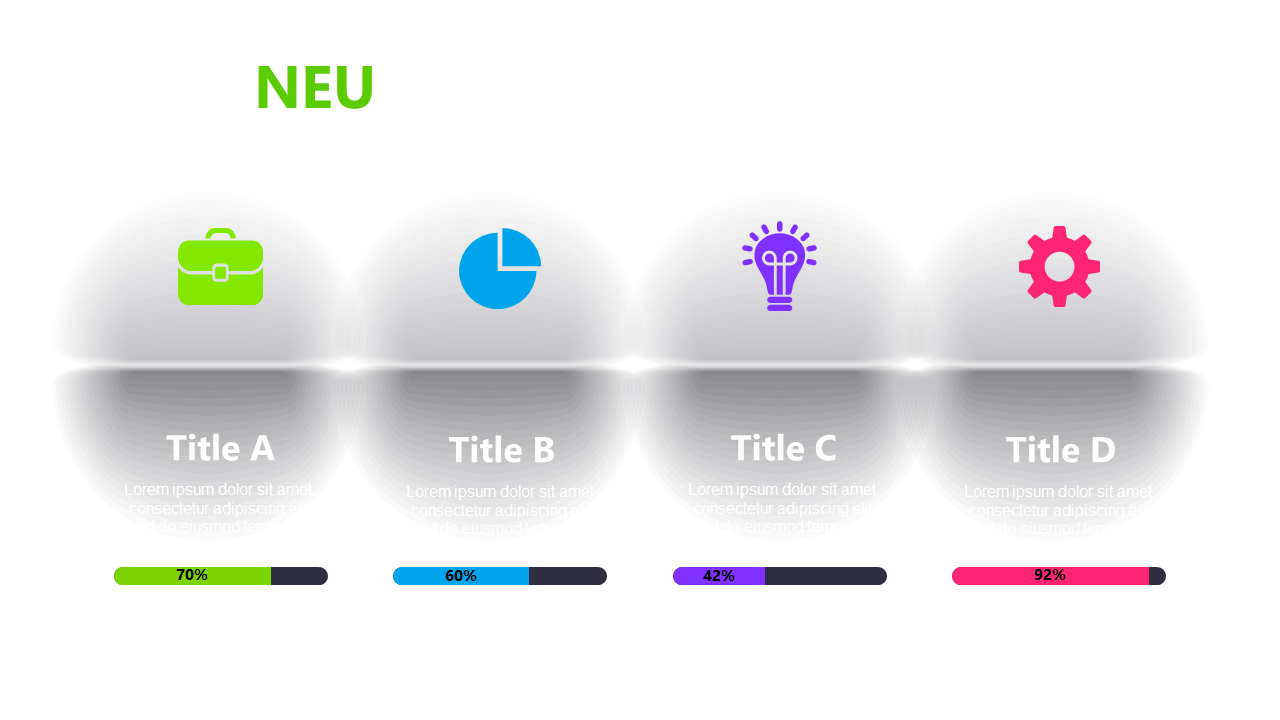
When you need to share key performance metrics but want to avoid overwhelming your audience with numbers and text, visual representation is the way to go. Circular progress indicators offer an immediate, impactful way to showcase how well you’re meeting your goals. This slide makes it easy to present performance data in a clean, visually engaging format.
This layout is ideal for marketing analysts reviewing campaign performance, sales managers tracking quarterly targets, or team leaders presenting project outcomes. It fits seamlessly into your performance reviews, KPI presentations, or even team meetings where you want to highlight progress and motivate your team.
Effective data communication is key, and this slide ensures clarity and engagement. For just $0.99, you can download this slide and easily edit it in both PowerPoint and Google Slides. It’s ready to use in minutes, giving you the freedom to customize icons and metrics to perfectly fit your presentation’s theme.
$0.99 – Purchase Checkout
Added to cart