Clarify Business Elements with Quadrant Diagram V2
Product Description
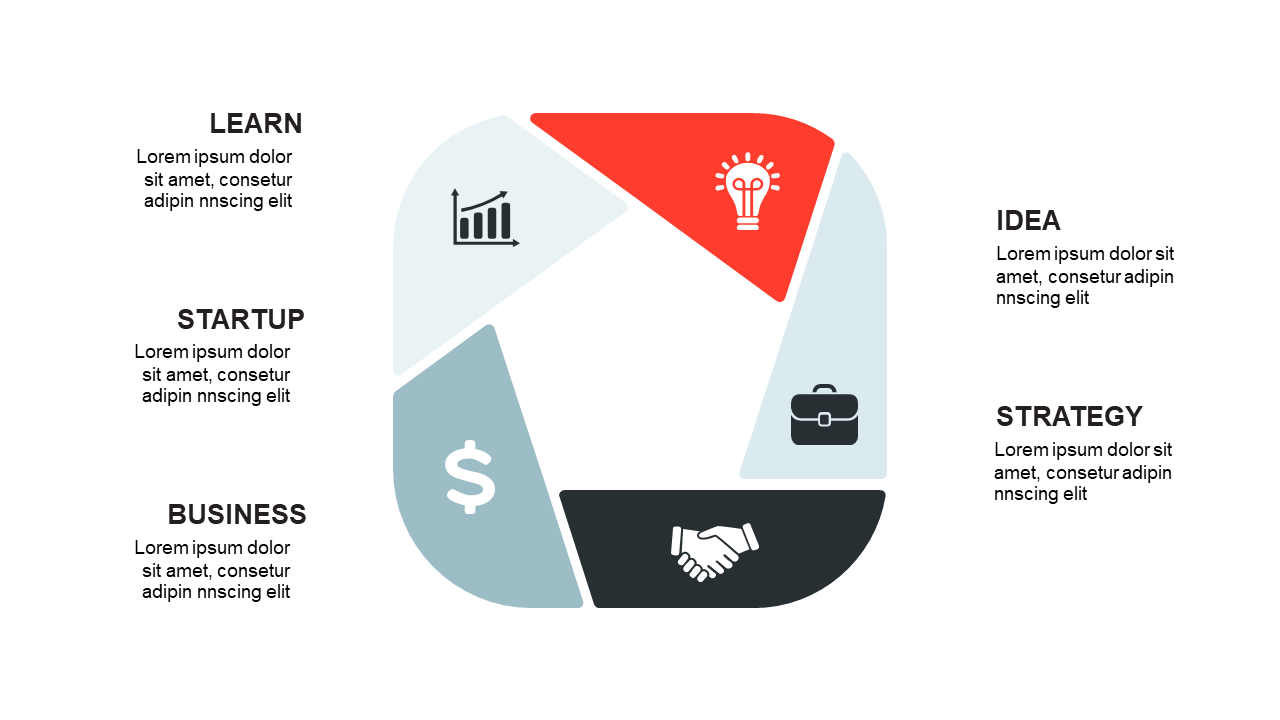
Presenting complex data can be overwhelming, especially when you’re trying to communicate key performance indicators to your team. You need a way to visualize those metrics that makes them easy to digest and discuss. The quadrant diagram simplifies intricate business frameworks, allowing your audience to see relationships and insights at a glance.
This slide is perfect for financial analysts preparing KPI reviews, project managers reporting on deliverables, or marketing professionals summarizing campaign performance. Whether you’re in a quarterly business review or a strategy meeting, this visual tool will help you articulate your points more clearly and effectively.
At just $0.99, this slide is ready for you to download instantly. It’s fully editable in PowerPoint and Google Slides, so
you can customize it to fit your brand and message in minutes.
$0.99 – Purchase Checkout
Added to cart