Visualize Business Intersections with Venn Diagram V3

Product Description
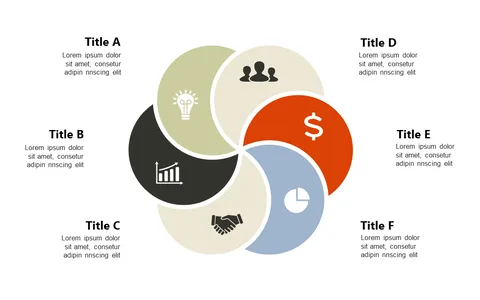
In a world flooded with data, clarity can often feel elusive. This Venn diagram slide cuts through the noise, providing a visually engaging way to depict overlapping concepts so your audience can easily grasp critical intersections.
Ideal for project managers working on cross-functional teams or marketing professionals sharing insights on customer segments, this slide makes it easy to present complex information in a digestible format. Use it during status updates or strategic planning sessions to foster understanding and collaboration.
For just $0.99, this slide can be yours for immediate download. It’s simple to edit in PowerPoint and Google Slides, ensuring you can adapt it quickly to fit your presentation style.
$0.99 – Purchase Checkout
Added to cart