Connect Business Concepts with Venn Diagram

Product Description
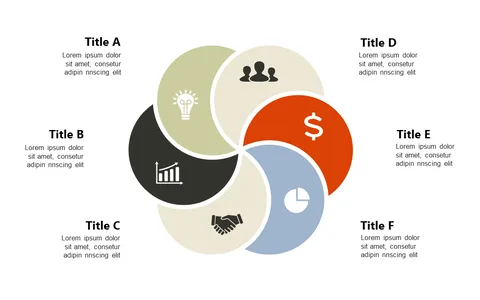
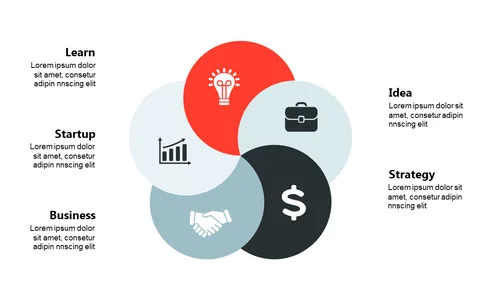
Conveying the connections between various business concepts can be tricky, especially when you’re working with complex ideas. This Venn diagram clarifies relationships and overlaps, allowing your audience to grasp key insights at a glance.
It’s perfect for business analysts, marketers, and educators alike, making it useful for presentations on market segmentation, competitive analysis, or curriculum development. Whenever you need to illustrate relationships clearly, this diagram will serve you well.
Available for just $0.99, this slide is ready for instant download and can be easily customized in PowerPoint or Google Slides. Transform your presentations in minutes.
$0.99 – Purchase Checkout
Added to cart
✅ Instant delivery
✅ Fully editable
✅ PowerPoint & Google Slides
Category:
$0.99
Per slide · No minimum · Pay only for what you pick
✓ $0.99/slide
No minimum order
✓ Mix any category
No subscription
Building a full deck?
Mix slides from any of our 58 categories —
all merged into one PowerPoint.
$0.99/slide, no minimum.
Browse All Slides →