Visualize Business Relationships with Venn Diagram V3
Product Description
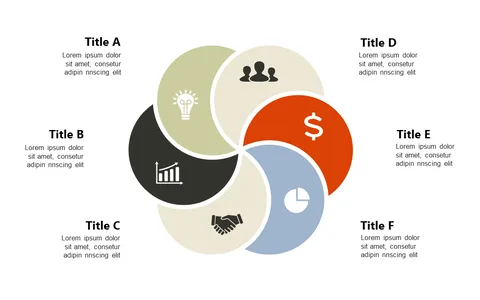
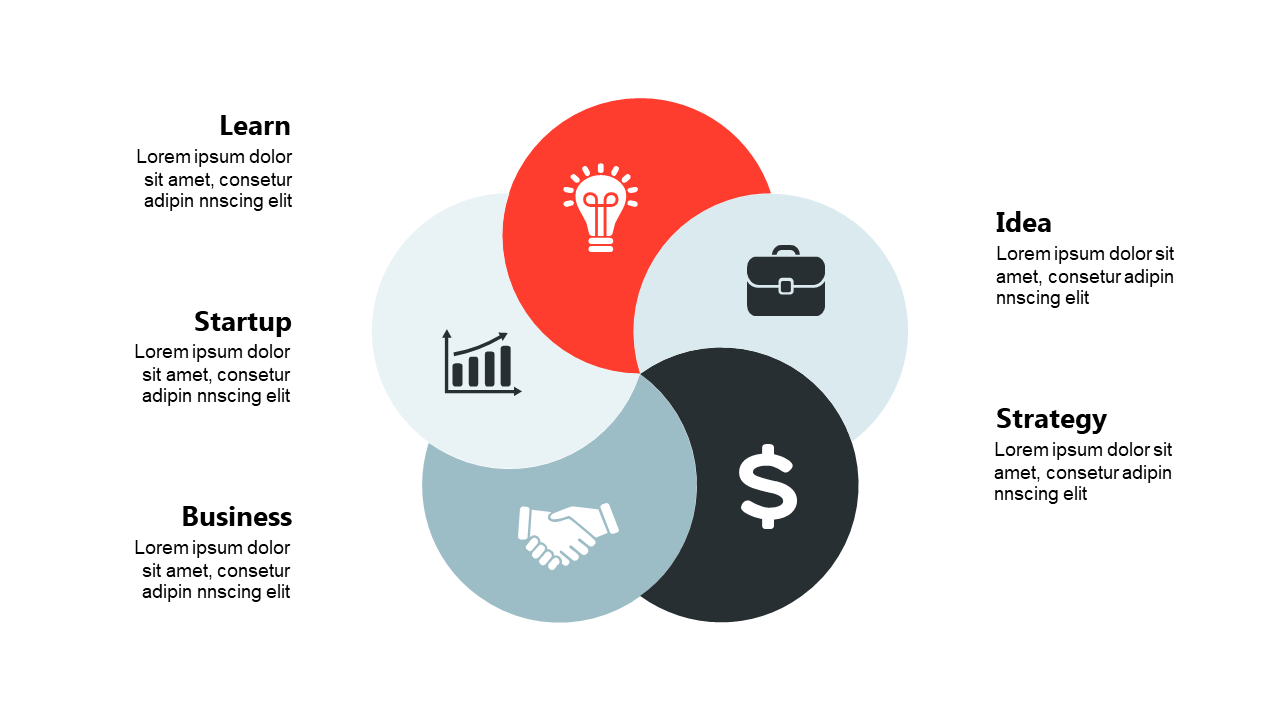
Communicating complex relationships within your organization can be a daunting task, especially when trying to showcase how innovation, finance, and collaboration overlap. This Venn diagram slide provides a clear visual representation that makes these connections easy to grasp, ensuring your audience stays engaged and informed.
As an operations manager, you can use this slide during team meetings, progress updates, or project kickoffs to illustrate how different departments work together toward common goals. It’s ideal for operational reviews, resource allocation discussions, or any circumstance where clarity is essential.
Available for just $0.99, this slide is a quick download that you can easily edit in both PowerPoint and Google Slides. You’ll have everything ready for your presentation in just minutes, making preparation a breeze.
$0.99 – Purchase Checkout
Added to cart