Engage with Financial KPIs and Risk Metrics
Product Description
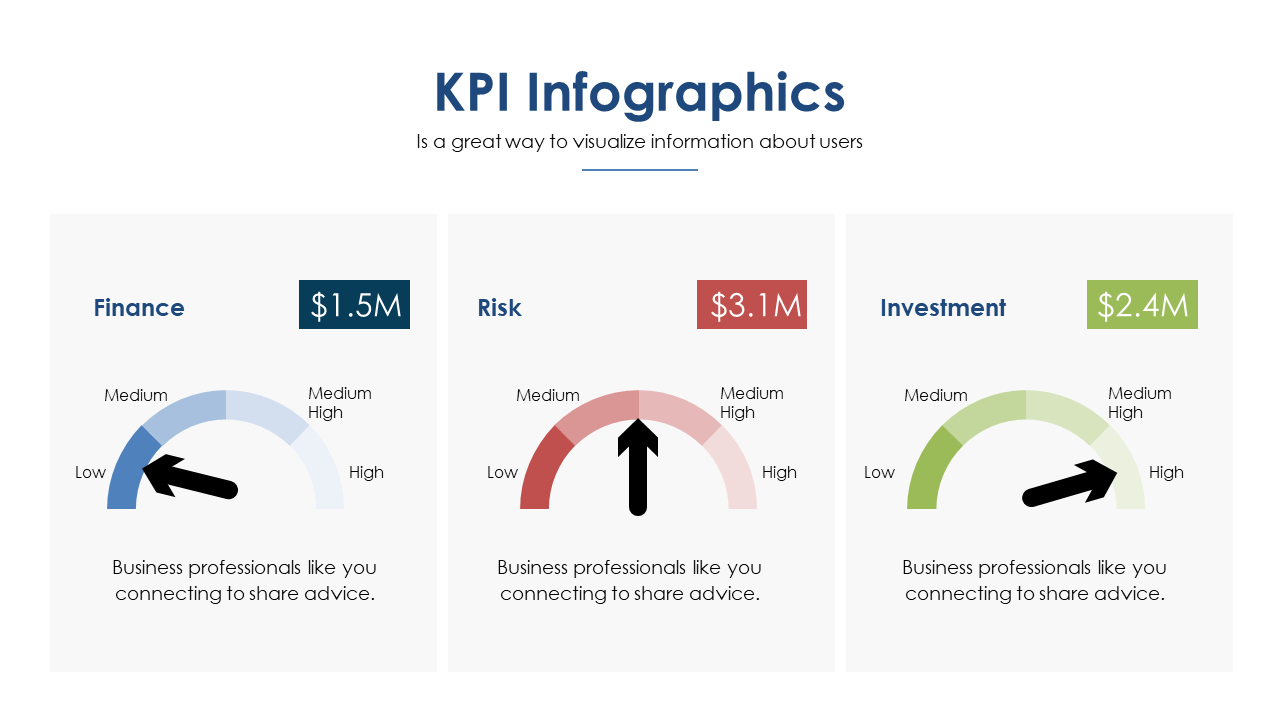
Dealing with complex financial data can often leave your audience confused and disengaged. This slide transforms key performance indicators and risk metrics into visually appealing graphics, making it easier to discuss financial outcomes and risk levels.
Finance professionals, business analysts, and risk managers will find this slide invaluable during budget meetings, financial reviews, or risk assessments. It’s designed to present the essential details in a digestible format that encourages discussion.
At only $0.99, this slide is available for instant download and can be easily edited in PowerPoint or Google Slides. Customize it with your financial figures and insights, and you’ll have an engaging presentation ready within minutes.
$0.99 – Purchase Checkout
Added to cart