Visualize KPIs with Engaging Gauges and Data
Product Description
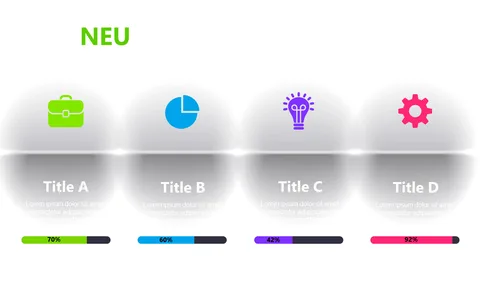
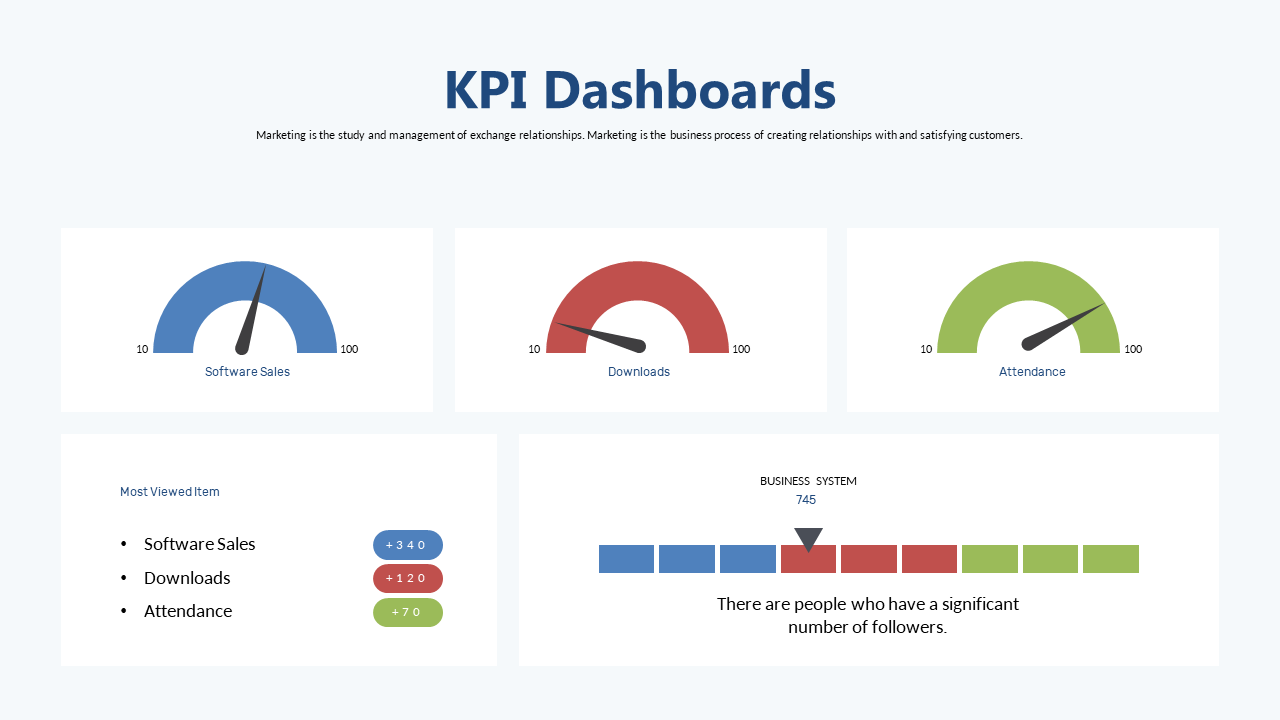
Feeling overwhelmed by the sheer volume of key performance indicators can make it challenging to engage your audience during presentations. This slide transforms complex data into captivating visual gauges, making it easier for everyone to grasp the important metrics at a glance.
It’s designed to keep your audience’s attention while ensuring they understand the data points you’re discussing. This slide is perfect for business analysts presenting quarterly results, marketing managers showcasing campaign performance, or operations managers during team briefings. Whether you’re in a boardroom meeting or leading a workshop, the engaging visuals will help you communicate your KPIs effectively and maintain focus.
For just $0.99, you can instantly download this slide and get started right away. It’s fully editable in both PowerPoint and Google Slides, allowing you to customize the visuals to suit your needs in just minutes.
$0.99 – Purchase Checkout
Added to cart