SlideSwift
By Category
💼Business 📊Infographics □Minimal 🕐Timelines ✨Neumorphic 🗑Diagrams 🔄Flow Charts ✨Glassmorphism 🎨Creative 🌍Abstract 🔄Cycle Diagrams 💎Isometric 🖼Illustrations 📱Social Media 🗺MapsBy Slide Type
🚀Pitch Deck 📌Roadmap 🔍SWOT Analysis 📅Timeline 📈Gantt Chart 🏢Org Chart 📋Funnel ⚖Comparison 📄Case Study 📋Agenda ⭐Icons & Lists 👏Thank You
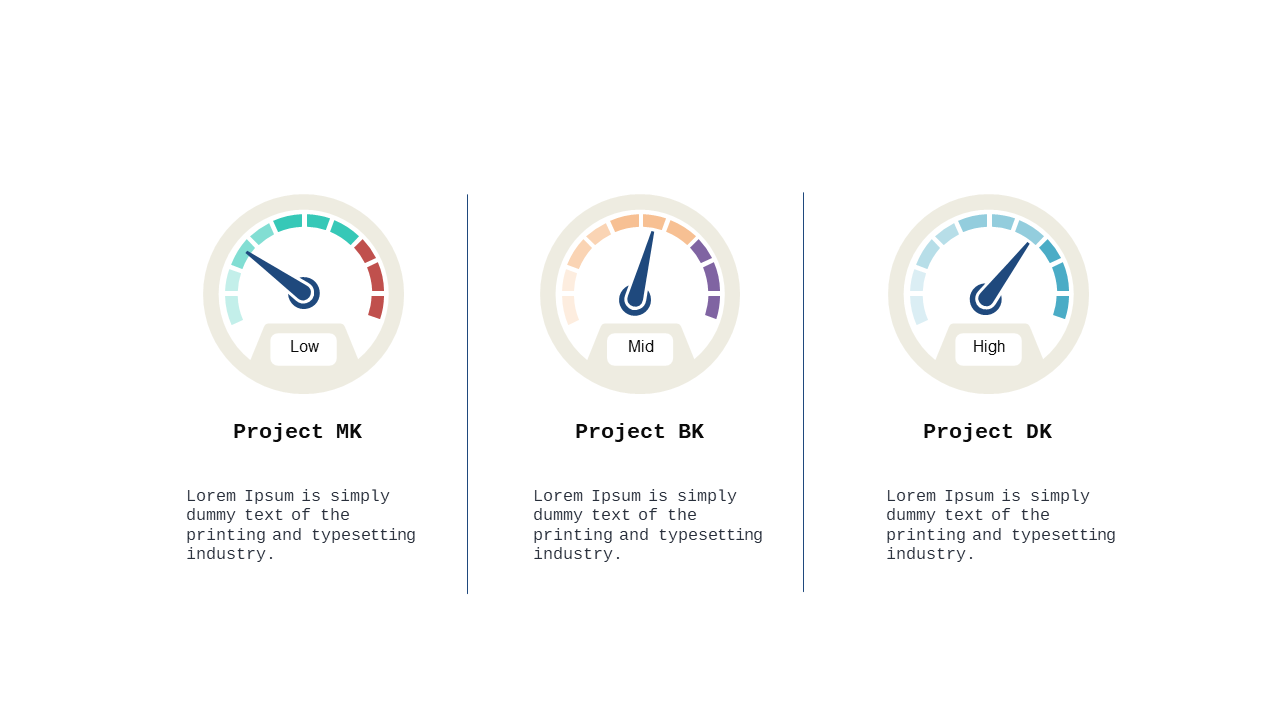
Managing multiple projects can often feel overwhelming, especially when you need to provide clear updates to stakeholders. This slide uses gauge charts to visually represent the status of various projects, making it easy to see where things stand at a glance. With clear segments indicating low, mid, and high statuses, you’ll have a straightforward way to communicate progress to your team. As a finance lead, you can quickly assess which projects need attention or resources. For a data analyst, this slide serves as an effective tool to present project metrics during team meetings, allowing for data-driven discussions. Meanwhile, a performance manager can utilize this visual to monitor ongoing projects and compare them against KPIs, ensuring that targets are met. Feel free to customize the project names and metrics to suit your needs. $0.99 — add this single slide to any deck from the SlideSwift Slide Library. No subscription needed. Mix slides from any category to build your perfect deck.
Add more from this category to your custom deck