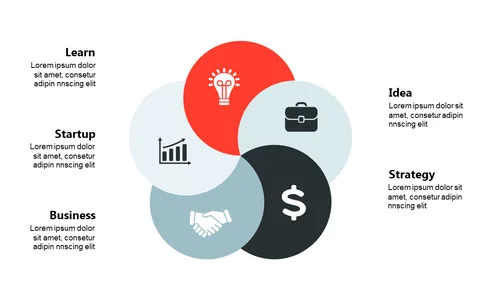
Engage with Circular Venn Diagram for Business V4
Product Description
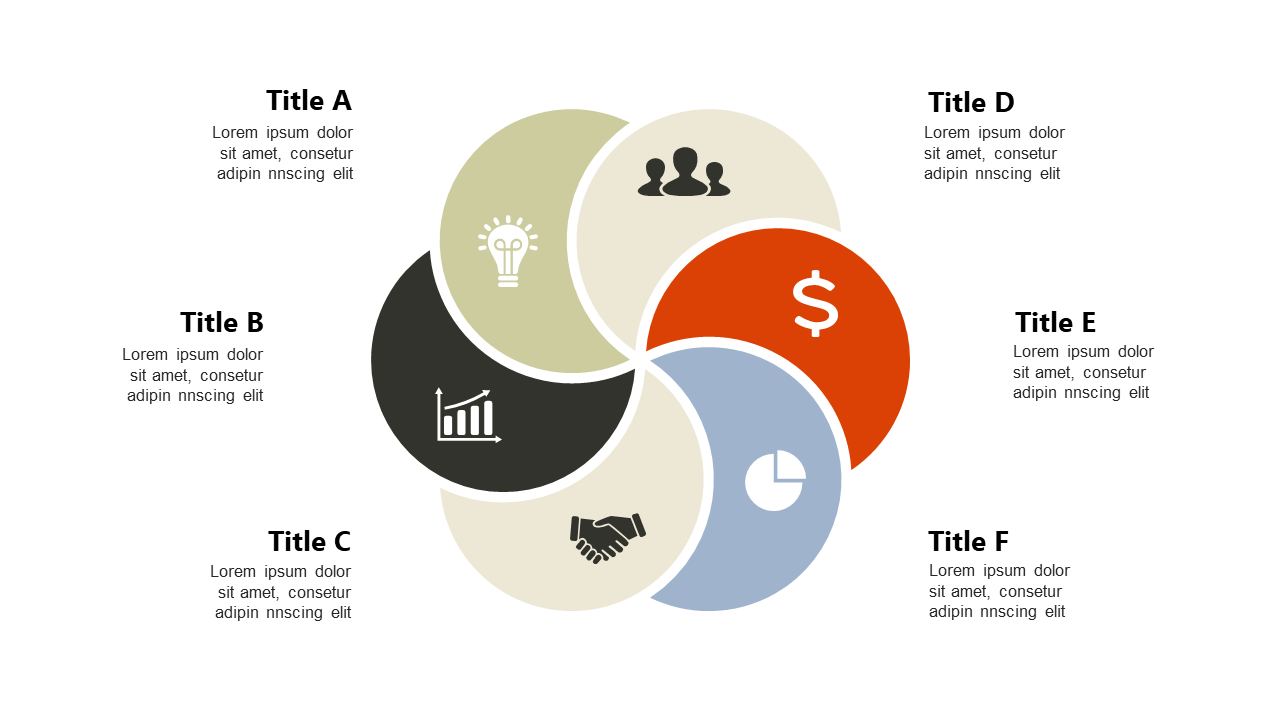
In finance, presenting complex relationships clearly is essential for effective communication. This circular Venn diagram slide enhances your ability to showcase intersecting metrics, making your message more impactful and easier to understand.
Finance analysts can utilize this slide in presentations to stakeholders or during team strategy sessions to illustrate budget overlaps and resource allocations. It also serves well for risk management discussions where comparing various risk factors is critical.
Available for only $0.99, you can instantly download this slide and start using it right away. It’s fully editable in both PowerPoint and Google Slides, letting you customize it to meet your specific needs in no time.
$0.99 – Purchase Checkout
Added to cart