Represent Overlapping Concepts with Circular Venn

Product Description
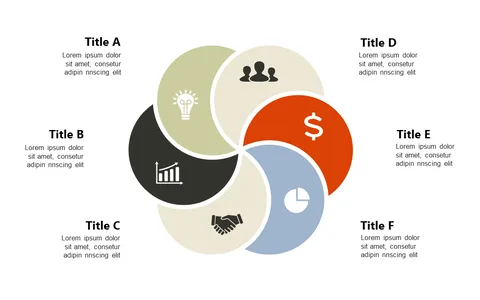
Visualizing overlapping concepts can feel like navigating a maze without a map. The circular Venn diagram slide simplifies this challenge, offering you a straightforward way to highlight and compare various metrics or ideas, ensuring clarity in your presentations.
This slide is perfect for data analysts in finance who need to represent key performance indicators or marketing managers showcasing the relationship between different campaigns. It transforms complicated relationships into an accessible visual format, making it ideal for quarterly reviews or strategy sessions.
For just $0.99, you can download this slide instantly. It’s fully editable in PowerPoint and Google Slides, allowing you to tailor it to your specific needs in just moments.
$0.99 – Purchase Checkout
Added to cart