Evaluate Project Status with Gauge Charts
Product Description
Keeping track of multiple projects can feel overwhelming, especially when clear communication of status is required. It can be difficult to deliver updates that provide quick insights at a glance.
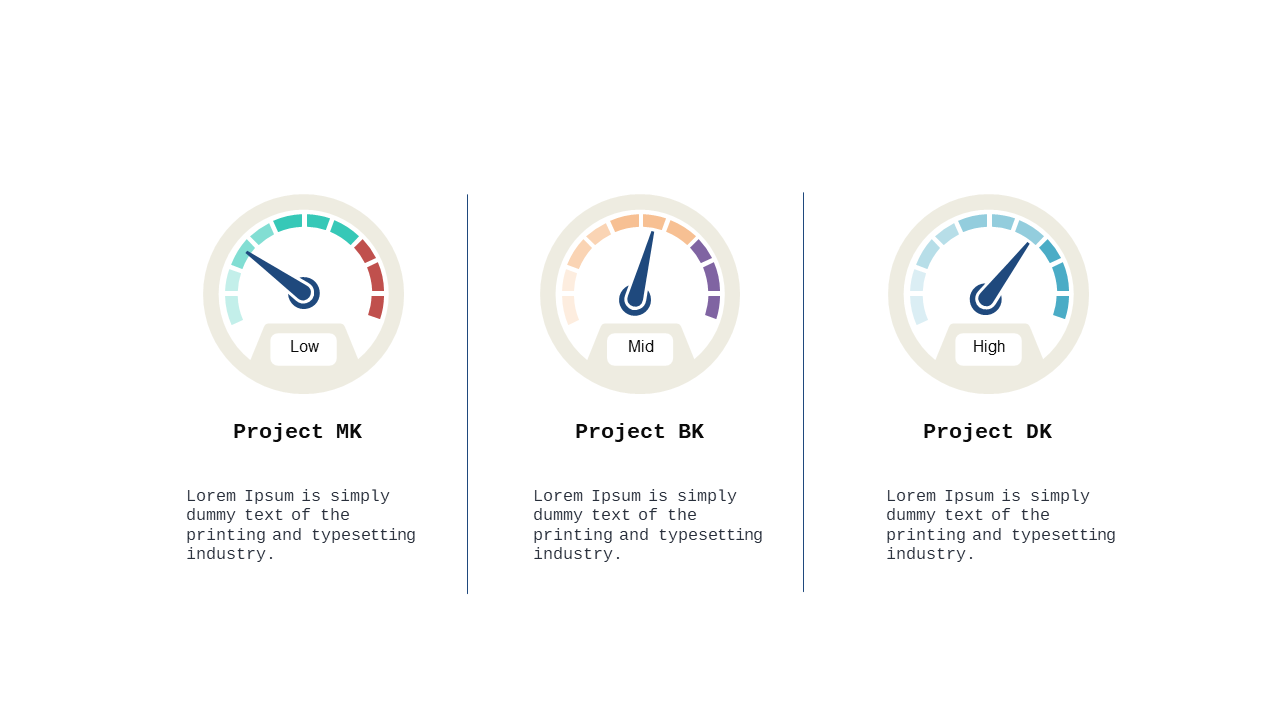
This gauge chart slide simplifies project evaluations, allowing you to present status updates in an intuitive and visually engaging manner. Ideal for project managers, team leads, and operations coordinators, this slide works great during project review meetings or status updates with upper management. Use it to provide clear visual summaries in strategy sessions or to keep team members aligned on project progress.
For only $0.99, this slide is an instant download, ready to edit in both PowerPoint and Google Slides. Customize it quickly to fit your project needs and keep everyone informed with ease.
$0.99 – Purchase Checkout
Added to cart