Visualize Global Business Metrics Clearly V2
Product Description
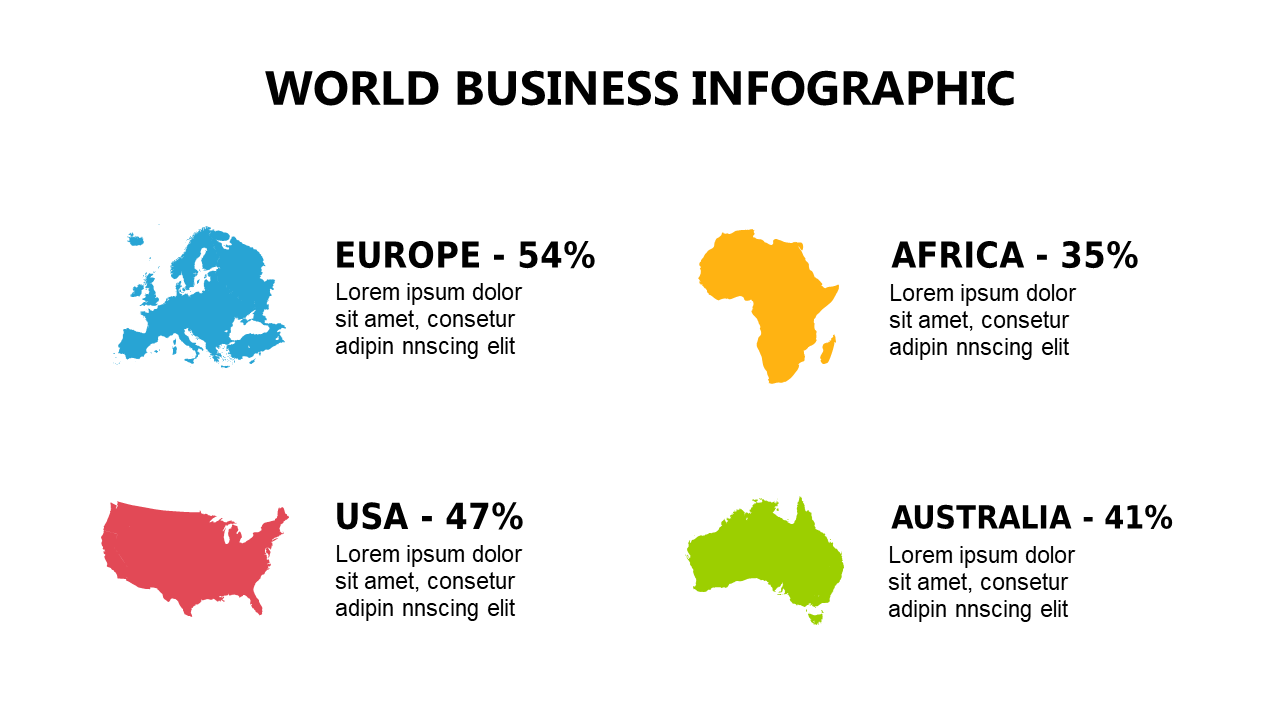
It’s often a challenge to present complex data in a way that captures your audience’s attention, especially when discussing geographical trends. This slide provides a captivating layout that organizes various regions alongside relevant business metrics, making your insights more digestible.
Market researchers, product managers, and sales directors will find this slide invaluable for creating impactful presentations during quarterly reviews or client pitches. It transforms heavy data into engaging visuals that can drive your points home effectively.
For only $0.99, you can instantly download this slide and customize it in PowerPoint or Google Slides. Present your data with confidence and clarity, making it easier for your audience to grasp important trends.
$0.99 – Purchase Checkout
Added to cart







