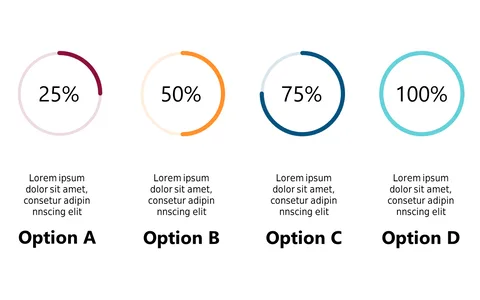
Visualize Progress with Stacked Bar Layout
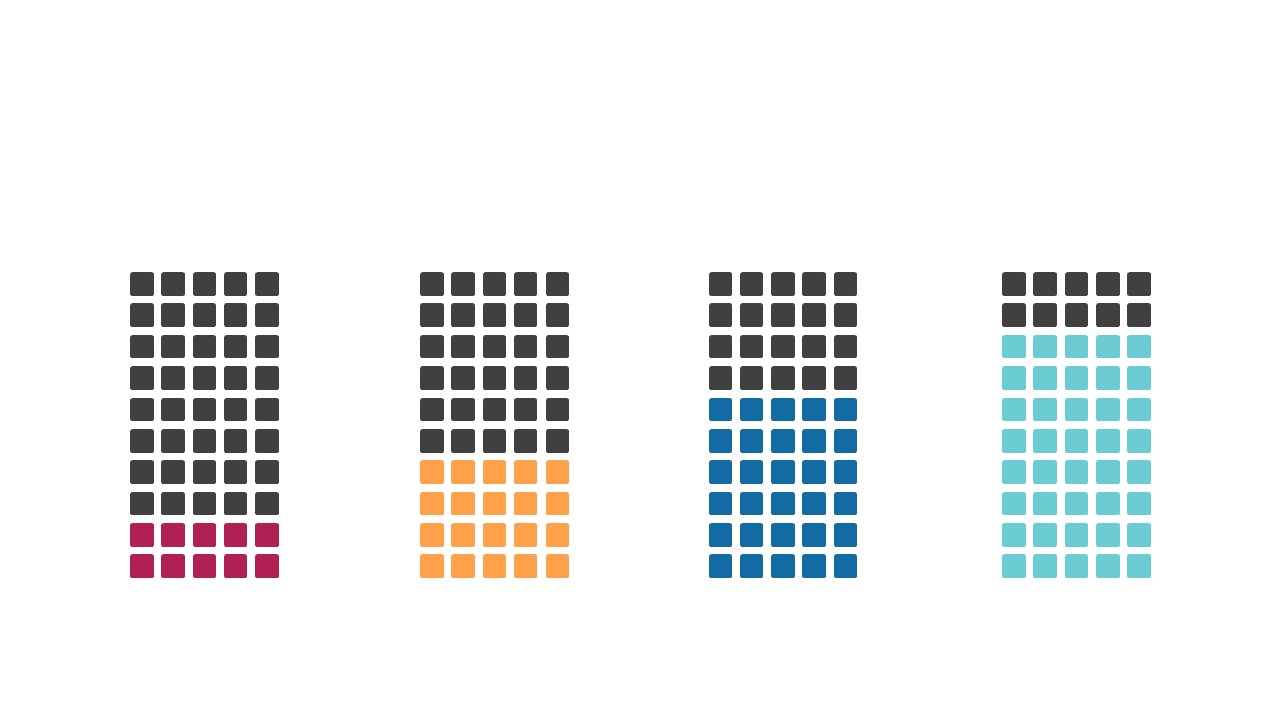
Product Description
Presenting progress in a visually engaging way can be tough, especially when you want to convey growth and milestones effectively. A stacked bar layout can help you transform raw data into a clear narrative, making it easier for your audience to grasp key performance metrics at a glance.
Project managers can deploy this slide during status updates to showcase milestones achieved, while marketers may use it in quarterly reviews to illustrate campaign progress. Analysts will find it perfect for highlighting performance trends over time, giving them the visual edge needed in meetings and reports.
At just $0.99, you can download this editable slide instantly and customize it to fit your needs in both PowerPoint and Google Slides. It’s designed to help you make an impact with minimal effort.
$0.99 – Purchase Checkout
Added to cart