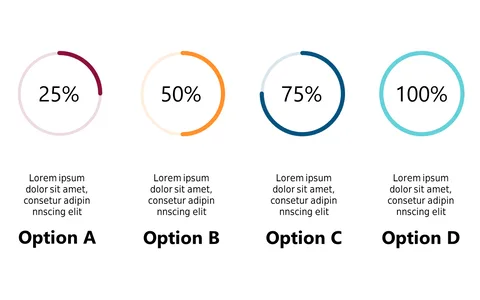
Engaging Radial Progress Indicators for Tech Presentations
Product Description
Finding effective ways to present complex data can often feel overwhelming, especially when you need to keep your audience engaged. With this radial progress indicator layout, you can visually represent various metrics in a way that’s easy to understand and compelling to look at.
This slide is perfect for tech project managers leading product launches, data analysts presenting quarterly reports, or team leads delivering updates in status meetings. It helps you communicate progress and performance metrics clearly, making it an essential tool for anyone in the technology sector.
Available for just $0.99, this slide is ready for instant download and can be easily edited in both PowerPoint and Google Slides. Customize it with your metrics to create an engaging presentation in minutes.
$0.99 – Purchase Checkout
Added to cart