Showcase Metrics with Horizontal Progress Bars
Product Description
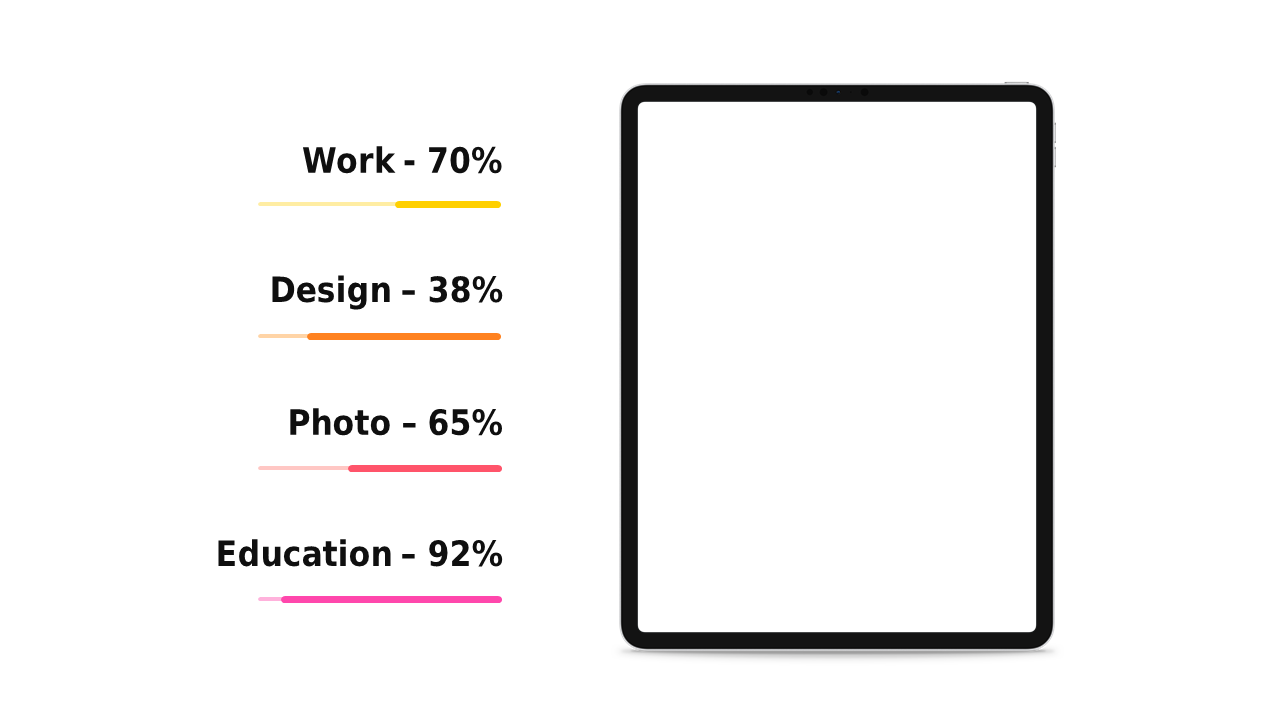
Struggling to convey complex data in a straightforward way? This layout with horizontal progress bars helps you visualize metrics effectively, making it easier for your audience to grasp performance indicators at a glance.
This slide is particularly useful for team leaders, data analysts, and educators during progress reviews, project updates, or analytical reports. Whether you’re comparing performance metrics in tech or education, this slide provides clarity and focus to your data storytelling.
Available for just $0.99, this slide is ready for instant download and is editable in both PowerPoint and Google Slides. You can easily tailor the progress bars and colors to fit your specific data, so presenting metrics becomes a breeze.
$0.99 – Purchase Checkout
Added to cart