Visualize Sales Insights with Waterfall Chart Infographic
Product Description
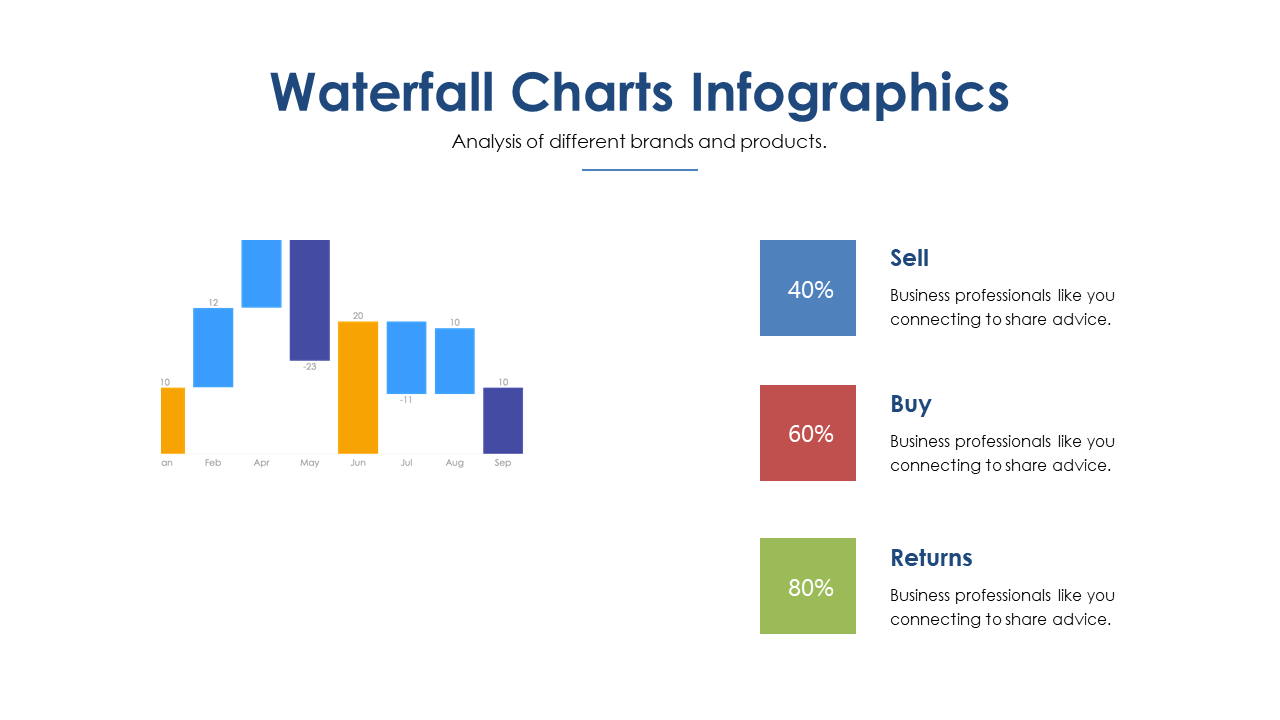
Communicating sales data effectively is a significant challenge, especially when trying to illustrate trends and changes clearly. This Waterfall Chart Infographic addresses that need, visualizing the flow of sales, purchases, and returns in an engaging and straightforward manner.
It allows your audience to see the complete picture at a glance, promoting better understanding. Ideal for sales analysts presenting monthly sales reports, finance managers showcasing fiscal health, or marketing teams discussing impact on revenue, this slide meets a variety of scenarios. If you find yourself needing to convey complex financial information during team meetings or client briefings, this chart will help you communicate your insights effectively.
For only $0.99, this slide can be downloaded instantly and is fully editable in PowerPoint and Google Slides. You can make it uniquely yours in just a few minutes, ensuring your presentation is both professional and visually appealing.
$0.99 – Purchase Checkout
Added to cart







