Showcase USA Statistics with Annotated State Map
Product Description
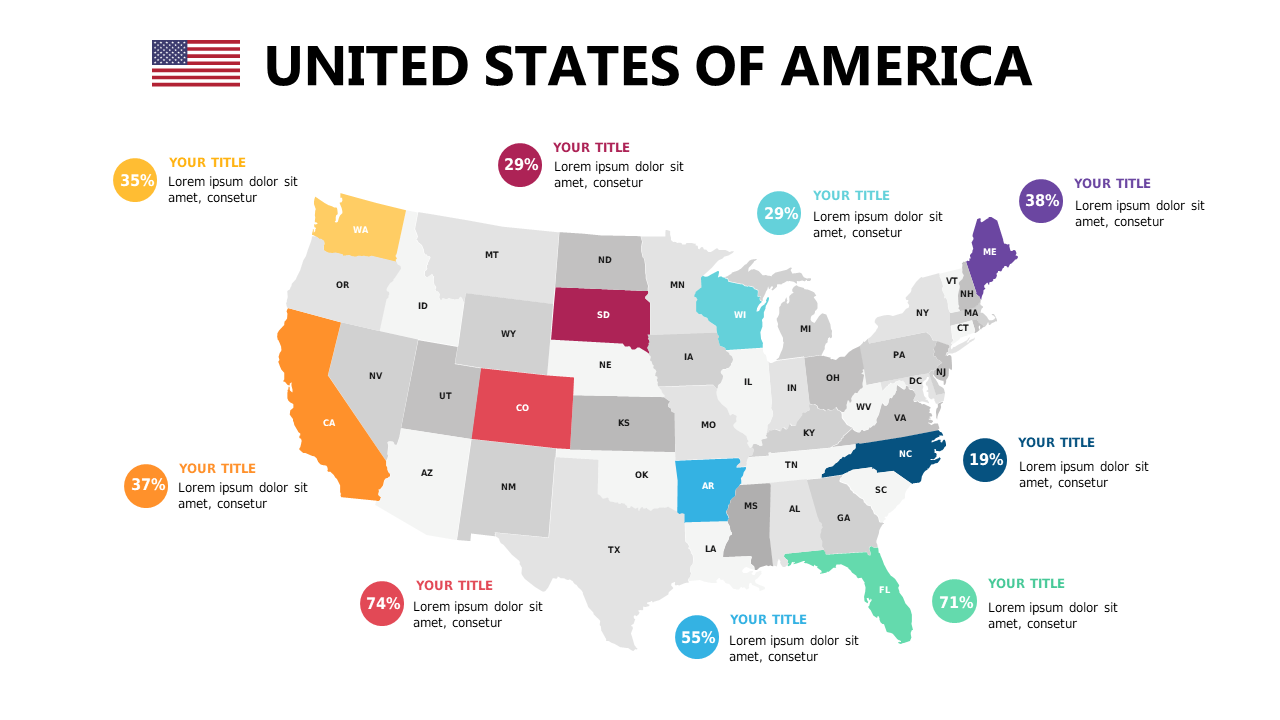
Navigating through statistical data can confuse your audience, especially when you’re discussing various regions across the United States. This annotated state map facilitates the presentation of percentages for each state, making it easier for your audience to grasp the insights behind your data.
Clear visuals enhance understanding and retention. This slide is perfect for professionals in analytics, market research, or sales, especially during presentations focused on regional performance metrics. It serves various purposes, from team reviews discussing market trends to client meetings where you need to present sales data and insights proficiently.
For only $0.99, you can download this slide and customize it effortlessly in both PowerPoint and Google Slides. With user-friendly editing features, you can have it ready for your next presentation in no time.
$0.99 – Purchase Checkout
Added to cart







