Customizable U.S. Heat Map for Data Analysis
Product Description
Making sense of complex data can feel overwhelming, especially when you’re under pressure to present insights quickly. A well-designed visual aid, like a heat map, can turn confusion into clarity by helping your audience see patterns and trends across different states.
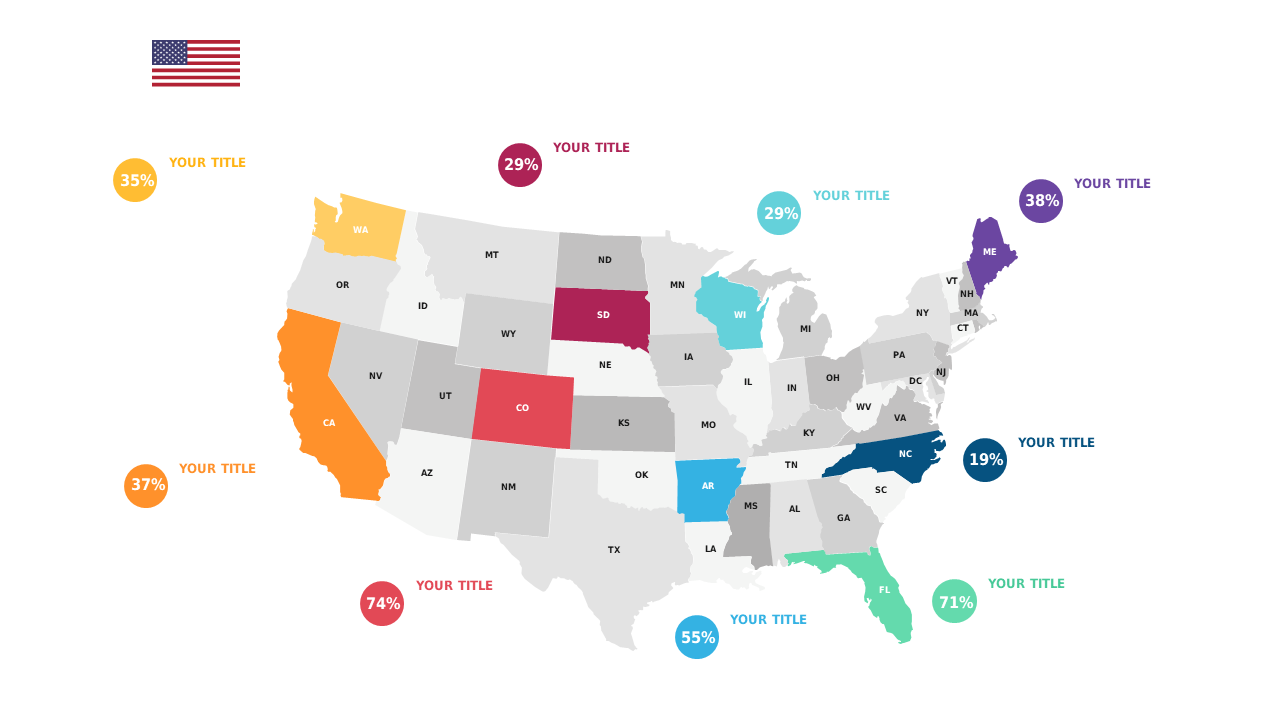
This customizable U.S. heat map lets you showcase essential metrics effectively, making data analysis digestible. Data analysts, marketing managers, and sales professionals will find this slide particularly useful during quarterly reviews or strategy meetings. Whether you’re reporting sales performance or analyzing customer demographics, this heat map is a versatile tool that enhances your storytelling by visually representing where your data matters most.
You can easily download this slide for just $0.99 and get started right away. It’s simple to edit in both PowerPoint and Google Slides, allowing you to tailor it to your specific needs in just minutes.
$0.99 – Purchase Checkout
Added to cart







