Visualize Key Metrics with a Triple Bar Chart
Product Description
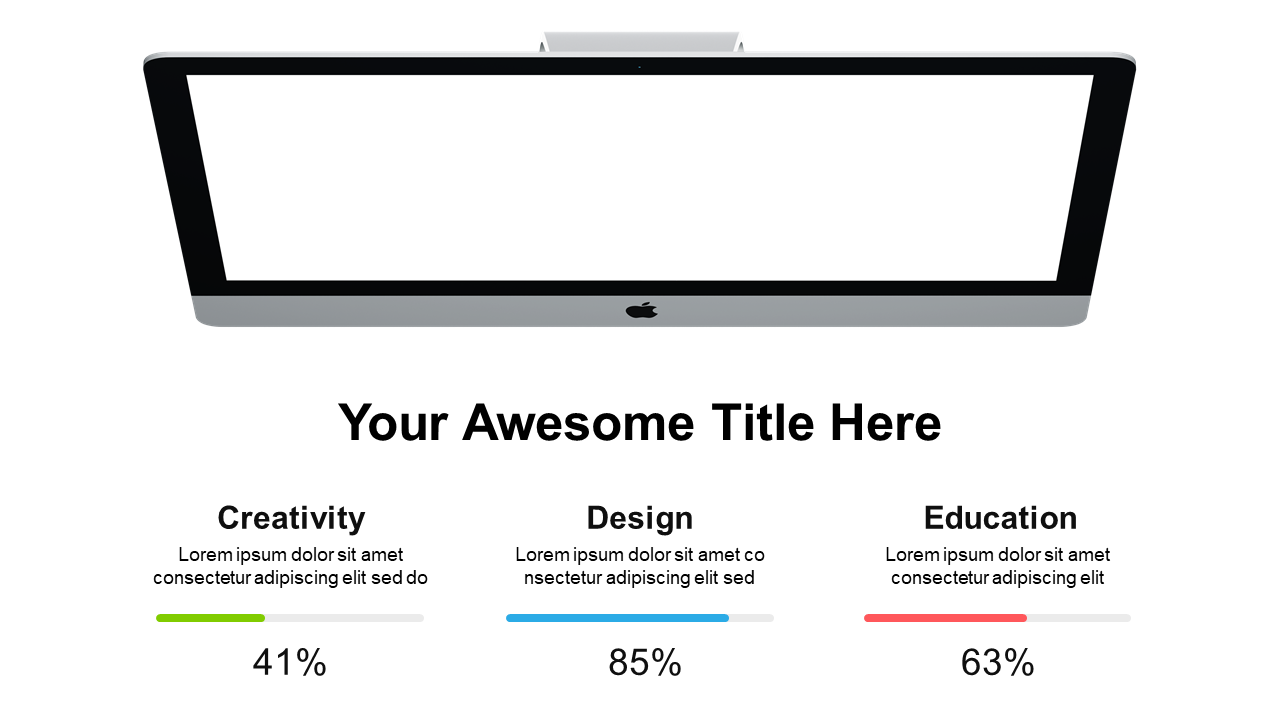
Visualizing key metrics can often feel like trying to tell a story without the right narrative tools. Presenting data in a way that is engaging and understandable is crucial to making your points resonate. A triple bar chart can effectively illustrate comparisons and trends, helping your audience connect with the information.
Data analysts and business development teams can use this slide when discussing performance metrics in team meetings or client presentations. It’s ideal for educators showcasing student performance across categories or marketers presenting campaign results.
The visual appeal captures attention while the structured data tells a story. At just $0.99, you can download this slide immediately and customize it effortlessly in both PowerPoint and Google Slides. You’ll find that modifying the data is a breeze, allowing you to prepare your presentation in minutes.
$0.99 – Purchase Checkout
Added to cart







