Contrast Ideas with Triangular Comparison Layout
Product Description
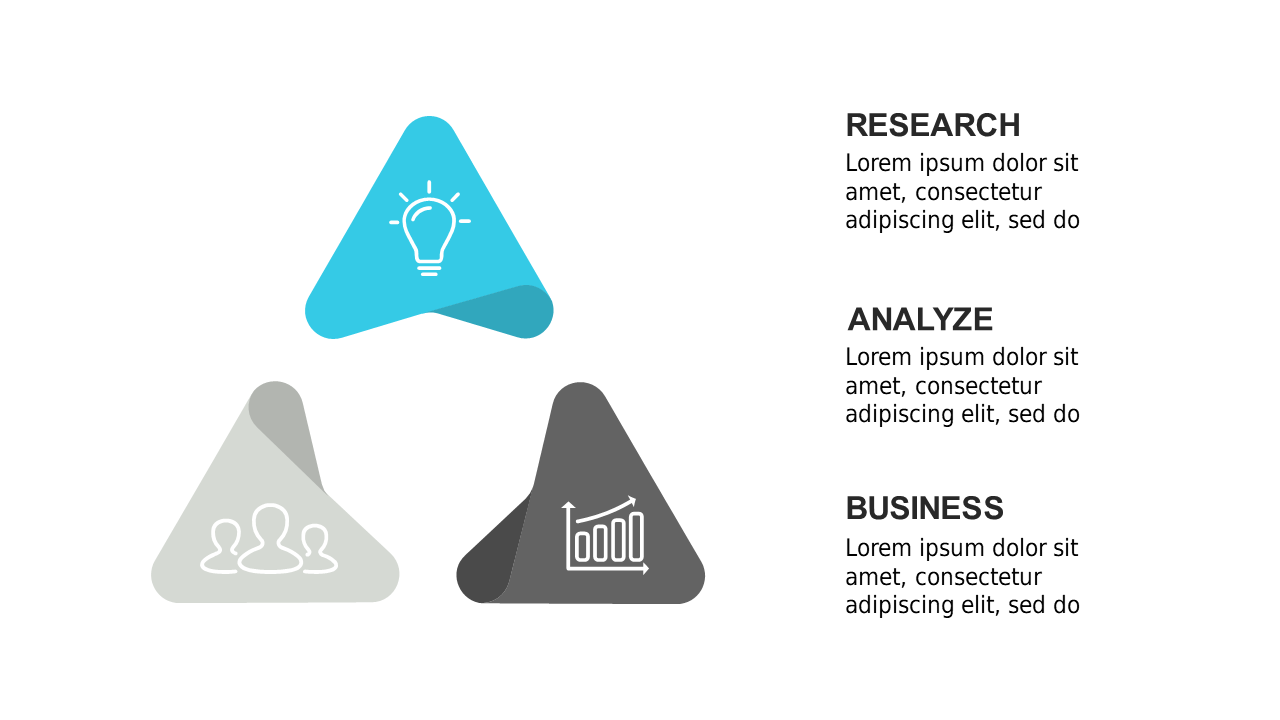
In a fast-paced work environment, presenting contrasting ideas can become convoluted and confusing. This slide provides a clean triangular layout that highlights the differences between three distinct concepts, making it easier for your audience to grasp complex information at a glance. Each idea is paired with an icon to enhance understanding and retention.
Consultants, educators, and business analysts often need to compare ideas in workshops, seminars, or client presentations. This slide is a perfect fit for those scenarios, as it allows you to clearly articulate the pros and cons of different approaches.
It helps facilitate a deeper understanding of the subject matter among your audience. Available for just $0.99, this slide is an instant download that you can easily edit in PowerPoint or Google Slides. Customize it to suit your needs in minutes, ensuring you’re always prepared for your next meeting or presentation.
$0.99 – Purchase Checkout
Added to cart