Visualize Change with Yesterday vs Today Comparison
Product Description
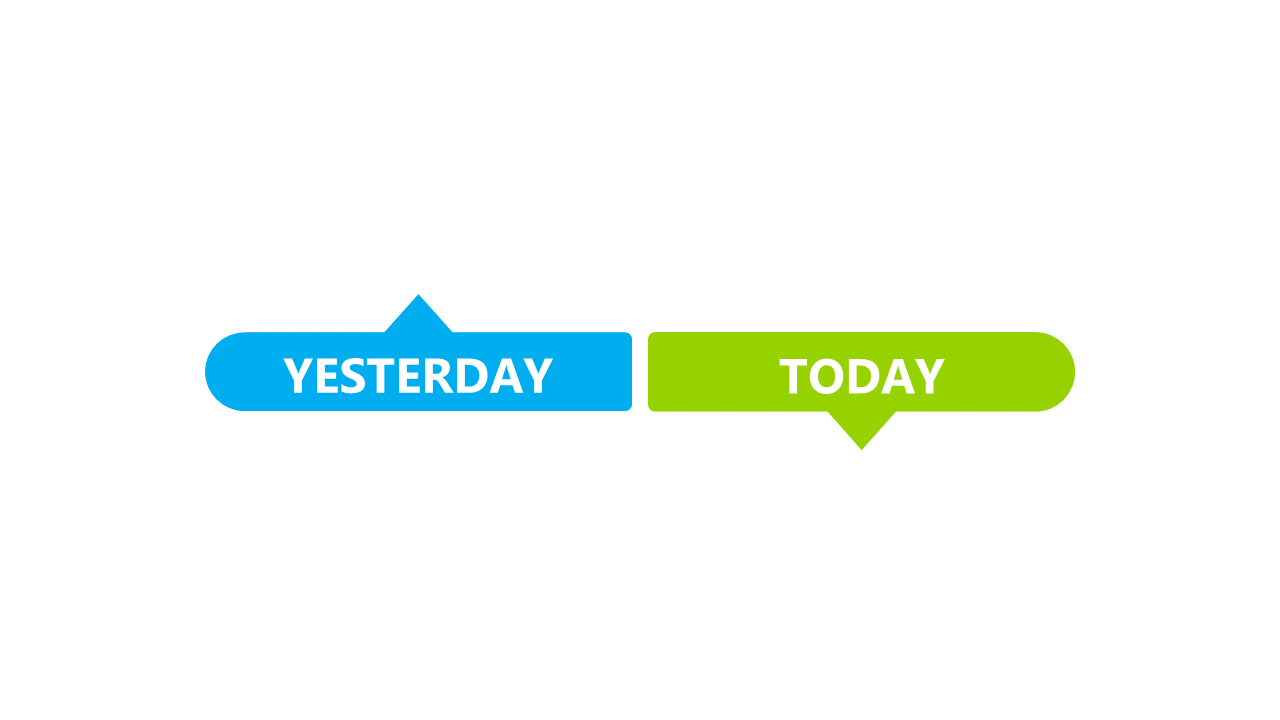
Highlighting the evolution of your business can be challenging, especially when you want to showcase clear progress over time. This slide layout offers a straightforward side-by-side comparison of “Yesterday” and “Today,” making it easy to illustrate meaningful changes or improvements.
Whether you’re a project manager presenting quarterly results, a sales leader showcasing growth metrics, or an HR professional discussing workforce developments, this slide provides a compelling way to convey your message. It’s specifically designed to appeal to audiences across various sectors, ensuring your progress is presented in a relatable way.
Available for just $0.99, this slide can be downloaded instantly and customized within minutes. You’ll find it easy to edit text and callouts in PowerPoint or Google Slides to align with your unique narrative.
$0.99 – Purchase Checkout
Added to cart







