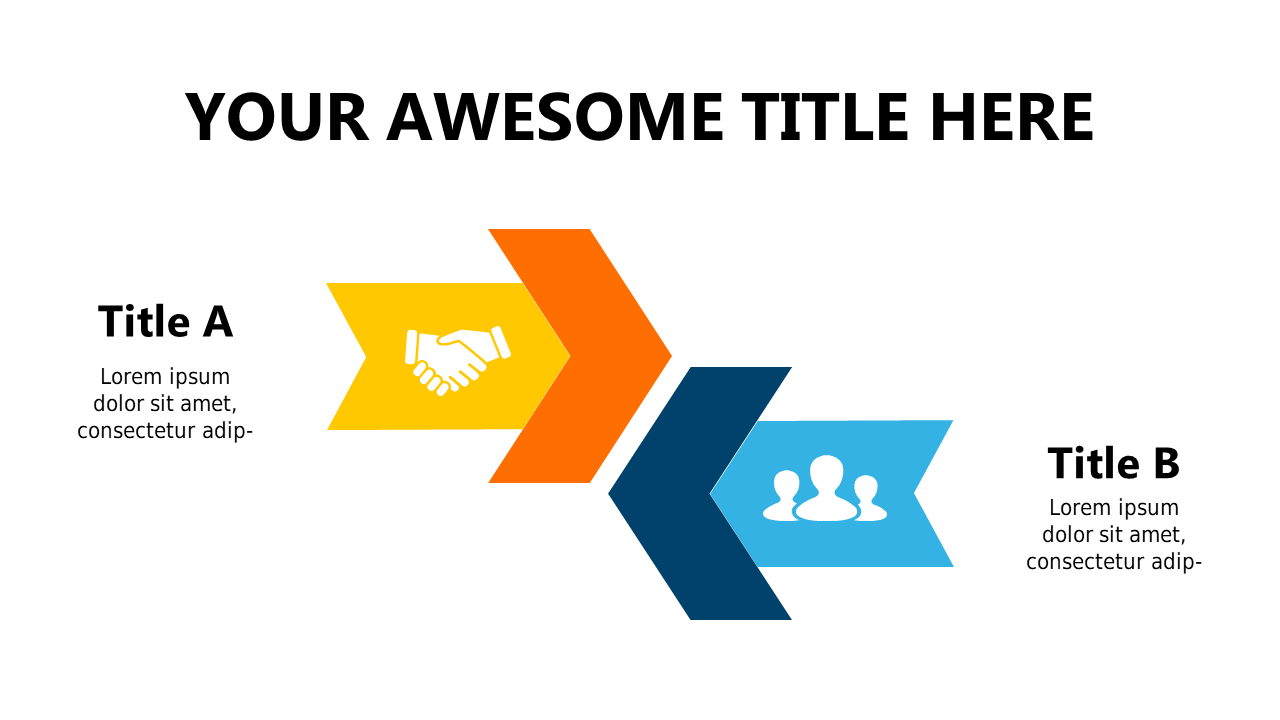
Two-Tier Chevron Comparison Layout
Product Description
In the fast-paced world of decision-making, presenting information clearly can make a significant difference. This two-tier chevron comparison layout is designed to help you showcase critical comparisons in a visually appealing manner, making it easier for your audience to see the differences at a glance. Its design focuses attention on what matters most.
Business analysts reviewing options, team leads discussing various strategies, or product managers comparing features will find this layout incredibly useful. It’s particularly effective during strategy sessions, presentations, or any scenario where clarity is key for making informed decisions.
With its distinct design, you can capture attention and drive your point home. For only $0.99, you can download this slide instantly and edit it in both PowerPoint and Google Slides. Customizing the icons and text is quick and straightforward, allowing you to tailor it to your needs with minimal effort.
$0.99 – Purchase Checkout
Added to cart