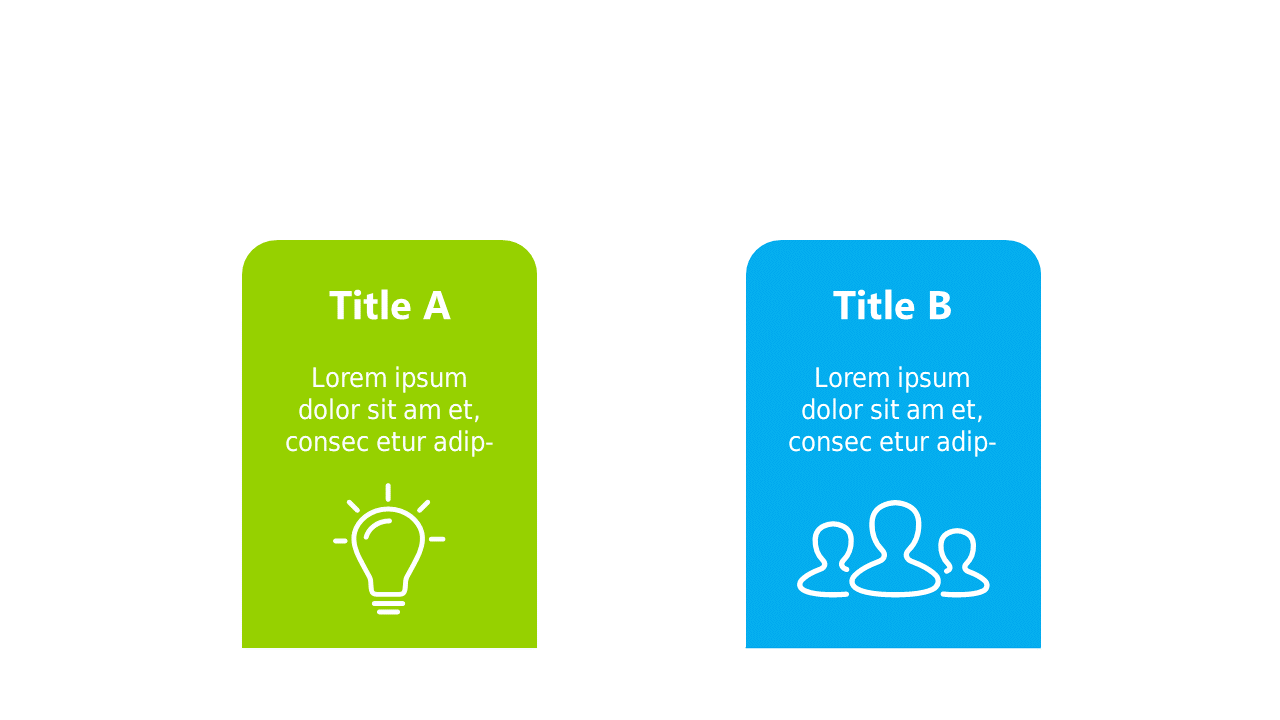
Clear Two-Column Comparison with Icons
Product Description
When you need to present clear distinctions between two options but struggle to maintain your audience’s attention, this layout comes to the rescue. It allows you to juxtapose features or concepts side by side, making the comparison not just logical, but visually engaging as well.
This slide is perfect for product managers making feature comparisons during product demos, marketers evaluating campaign strategies, or educators contrasting different teaching methods. Any scenario where clarity and impact are crucial will benefit from this straightforward two-column design.
For just $0.99, you can download this slide and have it ready in minutes. It’s fully editable in both PowerPoint and Google Slides, and
you can customize text and icons to fit your presentation’s needs perfectly.
$0.99 – Purchase Checkout
Added to cart







