Visualize Texas Demographics with Gender Breakdown
Product Description
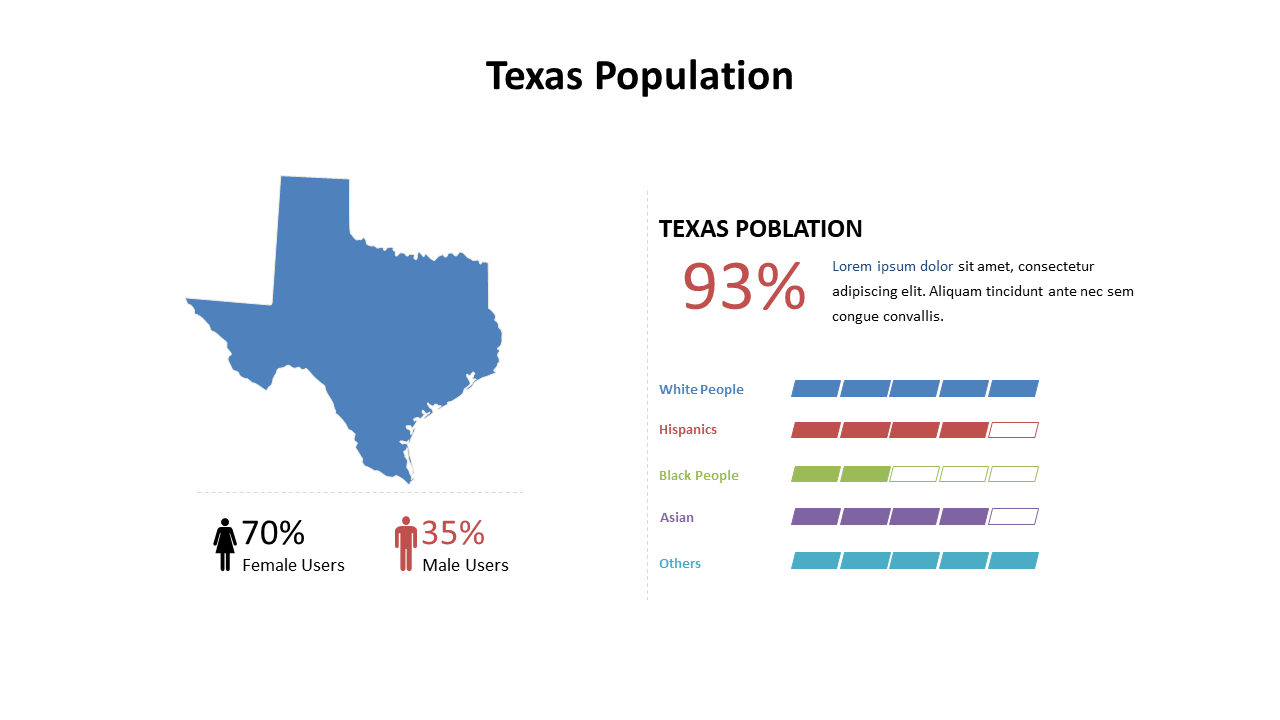
Demographics can be daunting, particularly when you need to present data concisely and clearly. This slide transforms complex information about Texas demographics into an accessible format, allowing you to focus on the insights that matter without overwhelming your audience.
Ideal for data analysts, marketing professionals, and regional managers, this slide comes in handy during team meetings, strategic planning sessions, or when preparing reports for stakeholders. By visualizing gender distribution alongside a state map, you can highlight critical trends in your presentations.
At only $0.99, this slide is a quick download that’s fully editable in both PowerPoint and Google Slides. Get started on presenting your Texas demographic insights in a straightforward and engaging manner in no time.
$0.99 – Purchase Checkout
Added to cart







