Showcase Data Insights with Stacked Bar Charts
Product Description
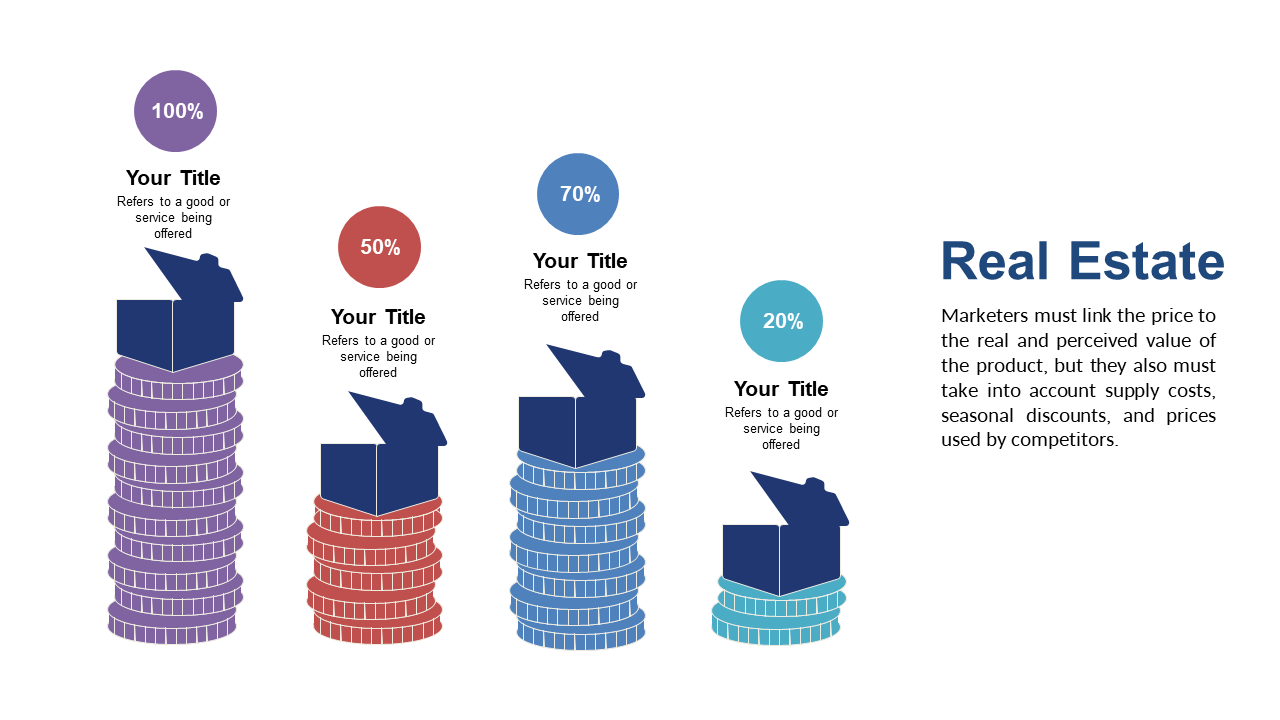
In a world where data drives decisions, presenting complex information in an understandable way can be a daunting task. This slide showcases stacked bar charts that vividly represent data insights, making it easier for your audience to digest and discuss critical information.
Business analysts, sales managers, and financial professionals can use this slide in reports, presentations, or sales pitches to illustrate performance metrics or market trends. The eye-catching design keeps your audience engaged and helps you convey your message effectively.
Available for just $0.99, this slide can be downloaded instantly and customized to meet your needs. It’s editable in both PowerPoint and Google Slides, so you can quickly tailor it to enhance your presentation.
$0.99 – Purchase Checkout
Added to cart







