Analyze Social Media User Stats with Comparison Slide
Product Description
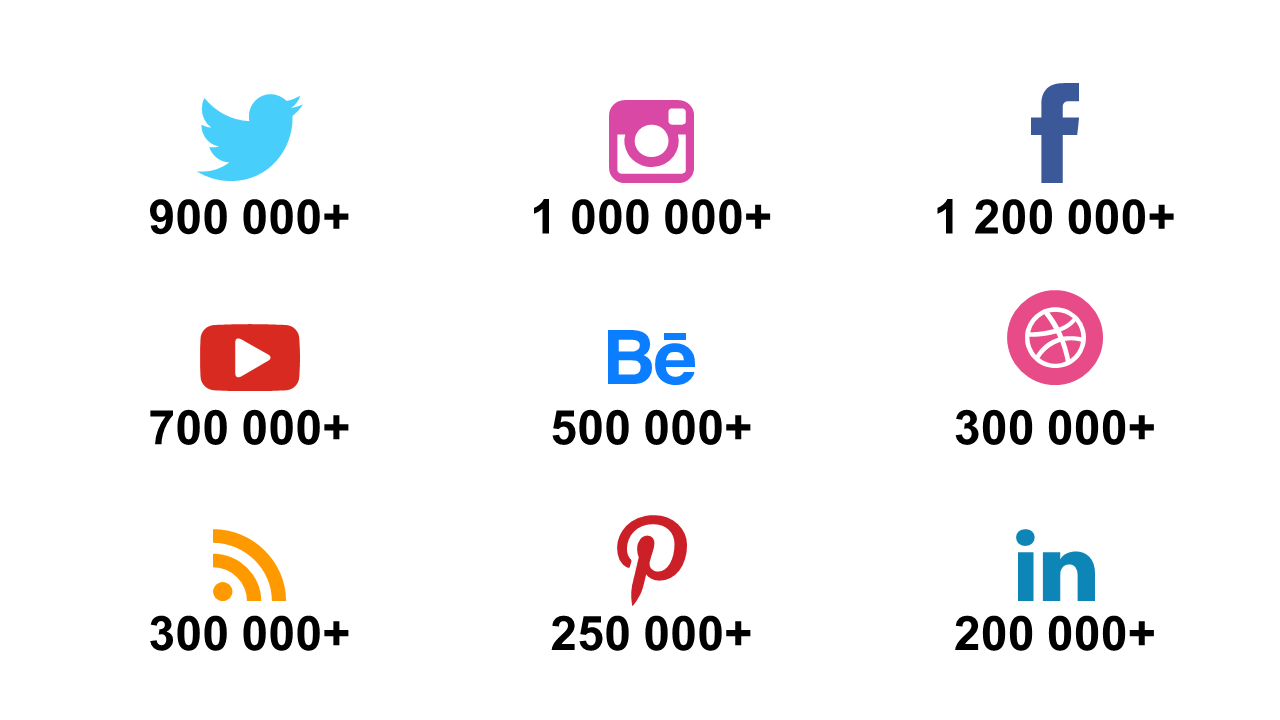
Keeping track of social media engagement across different platforms can be overwhelming, especially when trying to convey this information to your audience. This comparison slide lays out user statistics clearly, allowing you to present the data in a digestible format.
By showcasing the numbers alongside relevant icons, you can make your presentation visually impactful. Marketers analyzing social media trends, executives discussing audience growth strategies, or analysts reviewing engagement metrics will find this slide particularly beneficial. It provides a clear snapshot of how different platforms stack up against one another, which is essential in today’s data-driven marketing landscape.
You can easily download this slide for just $0.99 and make quick edits in PowerPoint or Google Slides. With everything set up for instant customization, you can prepare your presentation in minutes, saving you time to focus on your insights.
$0.99 – Purchase Checkout
Added to cart







