Visualize Social Media Users with Comparison Icons
Product Description
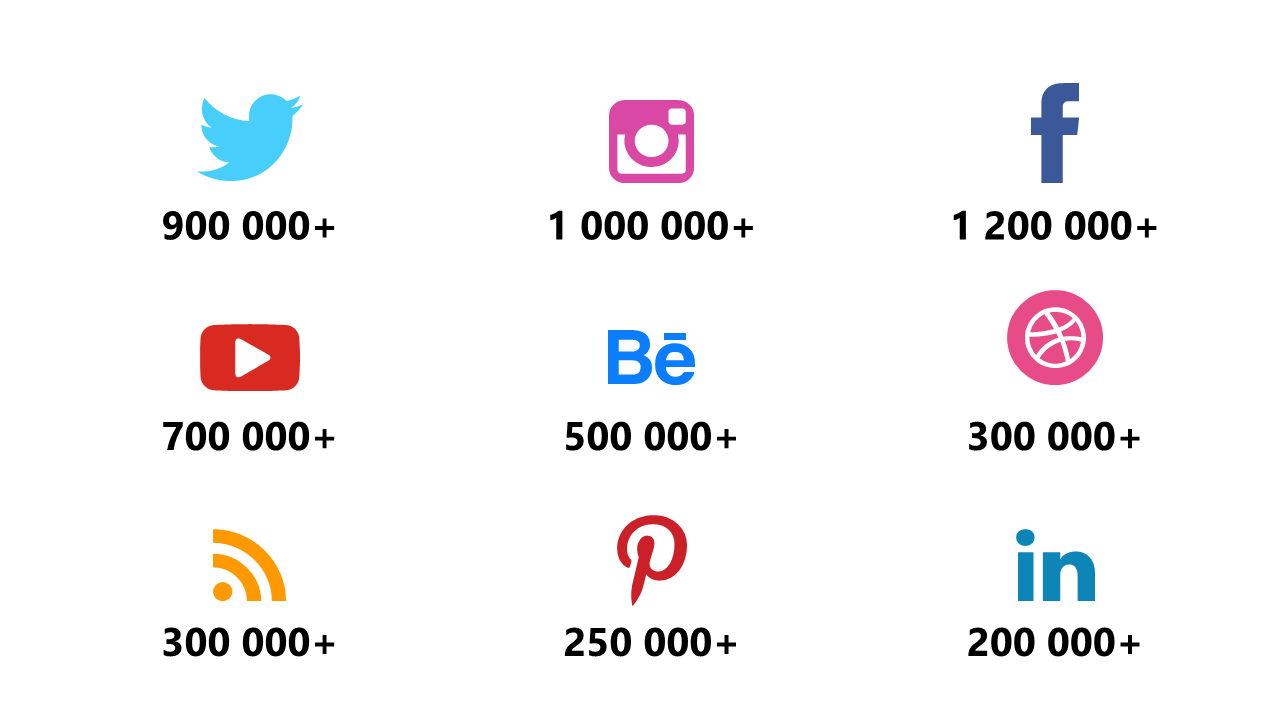
Simplifying the comparison of social media users is essential for impactful discussions, and this slide makes that easy. With clear icons and user counts, you can quickly convey the scale of your audience across various platforms without losing your audience in numbers.
This slide is perfect for marketing managers, data analysts, and executives presenting findings in sales meetings or social media strategy sessions. Use it to highlight user demographics, showcase platform performance, or demonstrate growth in audience engagement.
Download this slide for just $0.99, and you can instantly customize it to fit your needs. It’s ready for use in both PowerPoint and Google Slides, ensuring you can modify the stats and icons with ease.
$0.99 – Purchase Checkout
Added to cart







