Showcase Social Media User Stats with Icons
Product Description
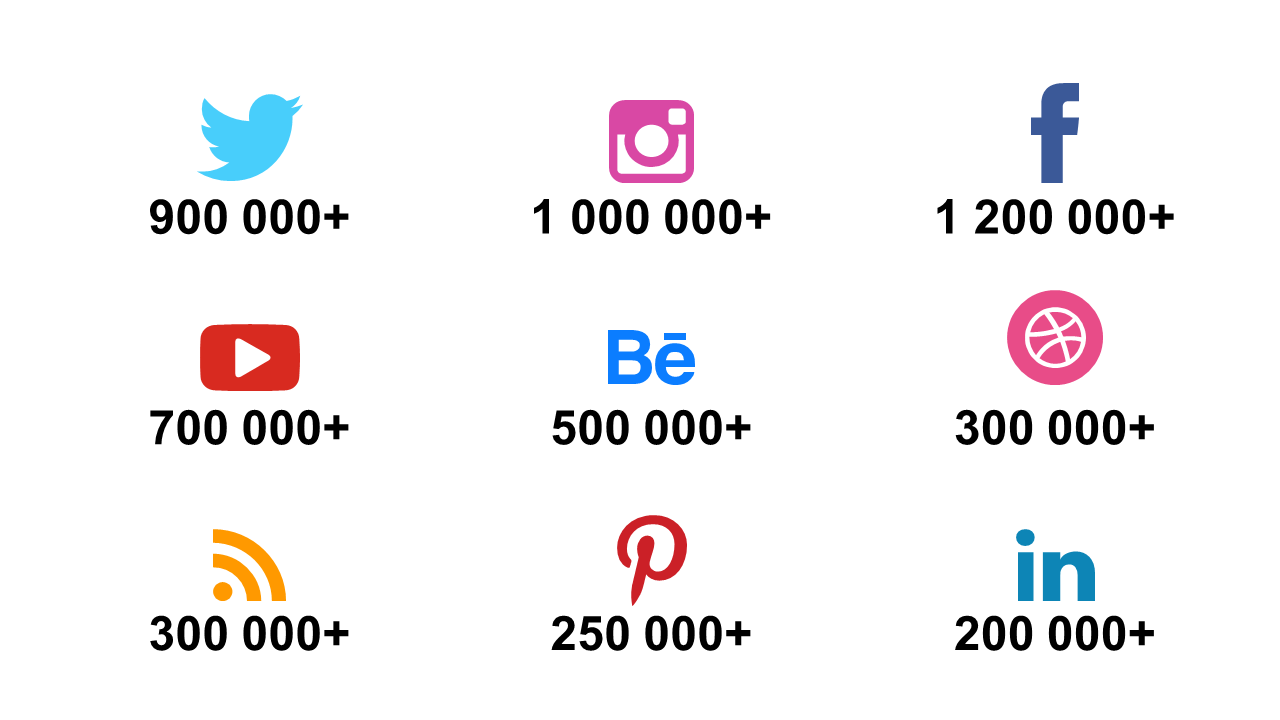
When data gets overwhelming, making sense of social media engagement across platforms is crucial. This slide helps you present user statistics in a clear, visually engaging way that turns complex numbers into actionable insights.
Marketers, social media analysts, and team leaders in digital marketing can benefit greatly from this layout during strategy meetings or quarterly reviews. By using this slide, you can easily compare user counts for different platforms, making it easy to identify trends and opportunities for growth.
For just $0.99, you can download this slide instantly. It’s fully editable in PowerPoint and Google Slides, allowing you to update stats or change icons as your data evolves.
$0.99 – Purchase Checkout
Added to cart







