Showcase Engagement Metrics with Icons
Product Description
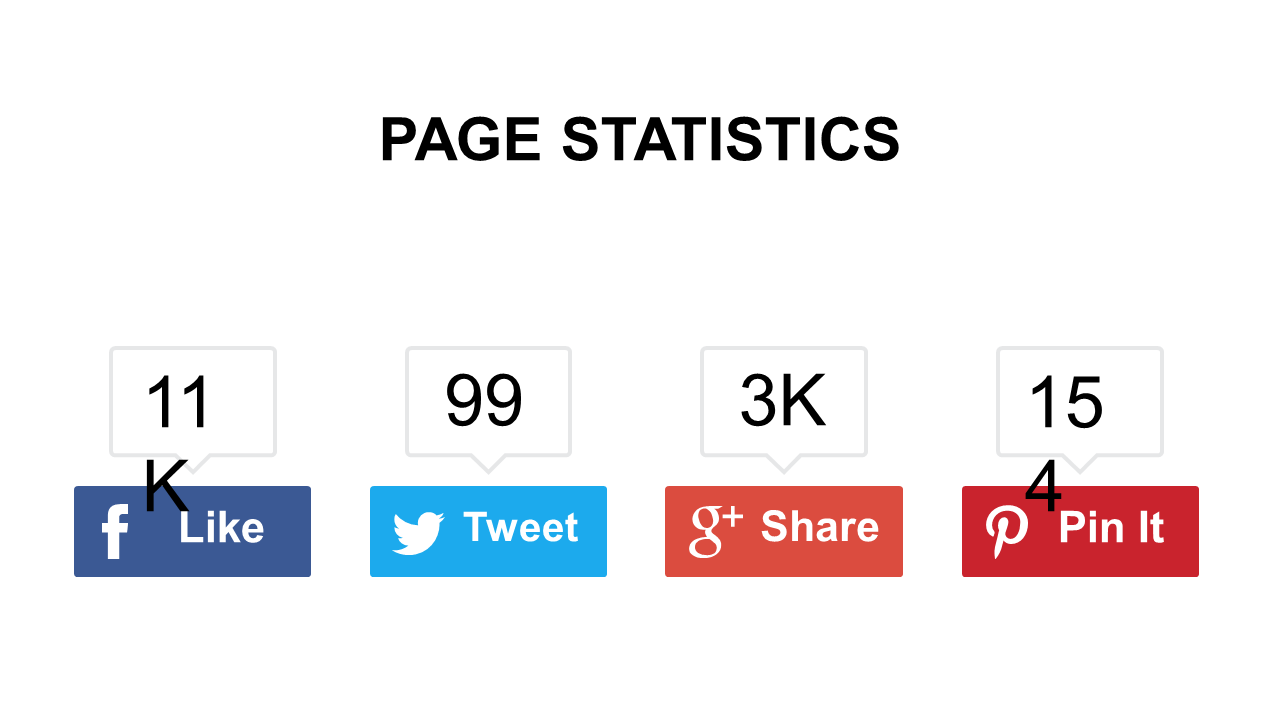
Data can often overwhelm your audience, especially when you need to convey engagement metrics quickly. With the right visual tools, you can transform complex statistics into easily digestible information using engaging icons that draw attention to key data points. This slide ensures your numbers shine while keeping your audience focused.
Marketing analysts, social media managers, and business development professionals will find this slide particularly useful when presenting engagement metrics during monthly performance reviews or strategy meetings. Picture yourself standing in front of your team, effortlessly guiding them through the latest social media insights without losing anyone’s interest.
This slide is your ally in making the data conversation engaging and impactful. For just $0.99, you can instantly download this slide and start editing right away in PowerPoint or Google Slides. Customize the icons, colors, and text to match your specific needs, making it easy to create a presentation that truly resonates with your audience.
$0.99 – Purchase Checkout
Added to cart







