Show Social Media Engagement Metrics in PowerPoint
Product Description
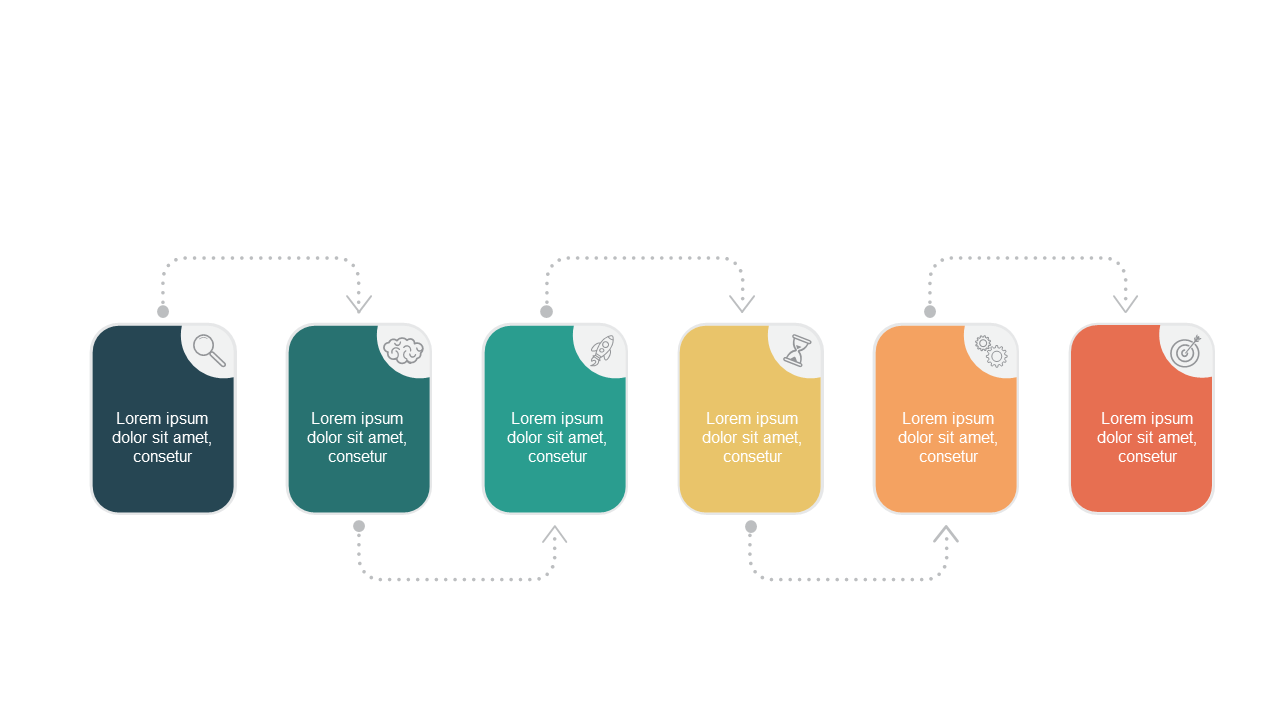
Translating numerical social media metrics into a compelling narrative can be a struggle, especially when your audience isn’t familiar with the data’s significance. This slide breaks down the engagement metrics into clear visuals, allowing you to tell a story that resonates with your viewers.
Perfect for social media strategists or digital marketers presenting during client updates or team planning sessions, this slide makes it easy to highlight interactions across different platforms. Whether you’re pitching a new campaign or analyzing past performance, having these visuals helps your audience connect with the data more effectively.
At just $0.99, you can instantly download this slide and transform your presentation. It’s simple to edit in both PowerPoint and Google Slides, ensuring you can make adjustments quickly and without hassle.
$0.99 – Purchase Checkout
Added to cart







