Present Social Media Engagement Metrics Visually Style
Product Description
Navigating the presentation of social media engagement metrics can feel daunting, especially if the insights aren’t communicated effectively. Your audience deserves a clear and compelling way to understand these important statistics.
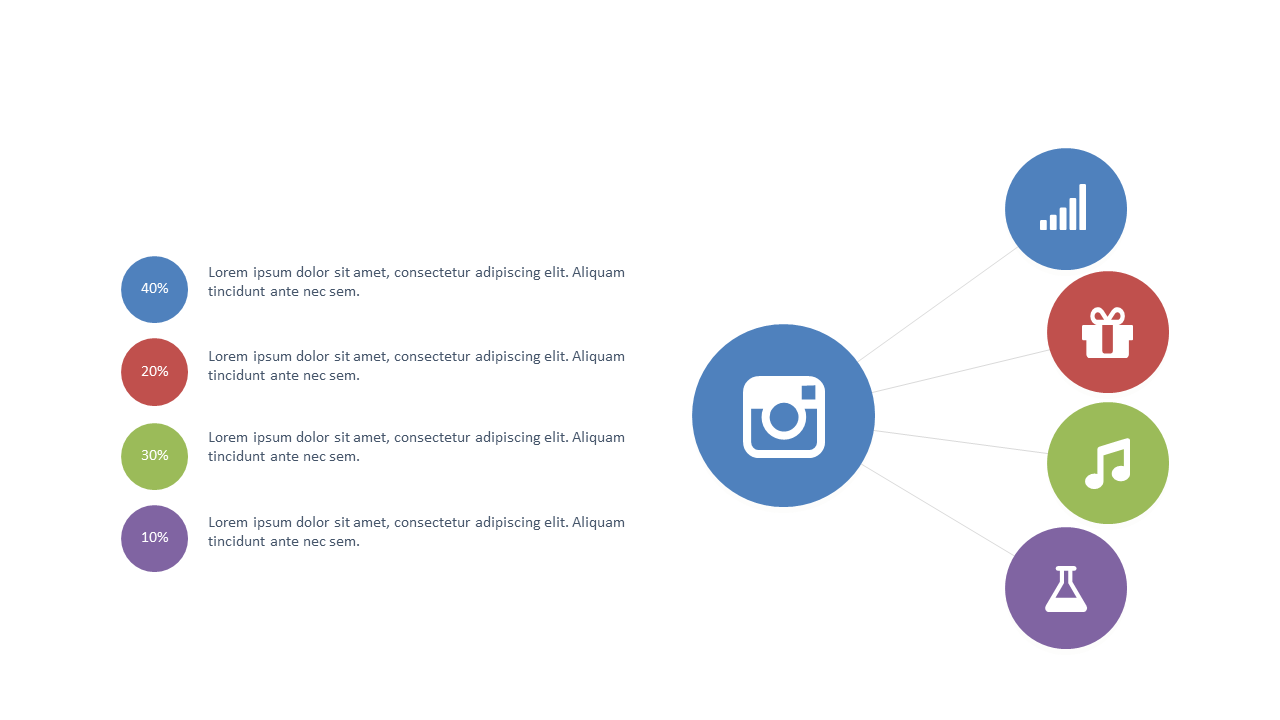
This slide provides a visually engaging layout that makes conveying engagement metrics straightforward and impactful. Ideal for social media managers, data analysts, and marketing professionals, this slide can be utilized in meetings where engagement metrics are analyzed. Whether you’re reporting on campaign performance or strategizing for future initiatives, this design will help convey your insights clearly and efficiently.
For only $0.99, you can easily download this slide and personalize it to meet your requirements. It’s editable in both PowerPoint and Google Slides, enabling you to get everything ready for your presentation quickly.
$0.99 – Purchase Checkout
Added to cart







