Compare Social Media Engagement with Bar Chart
Product Description
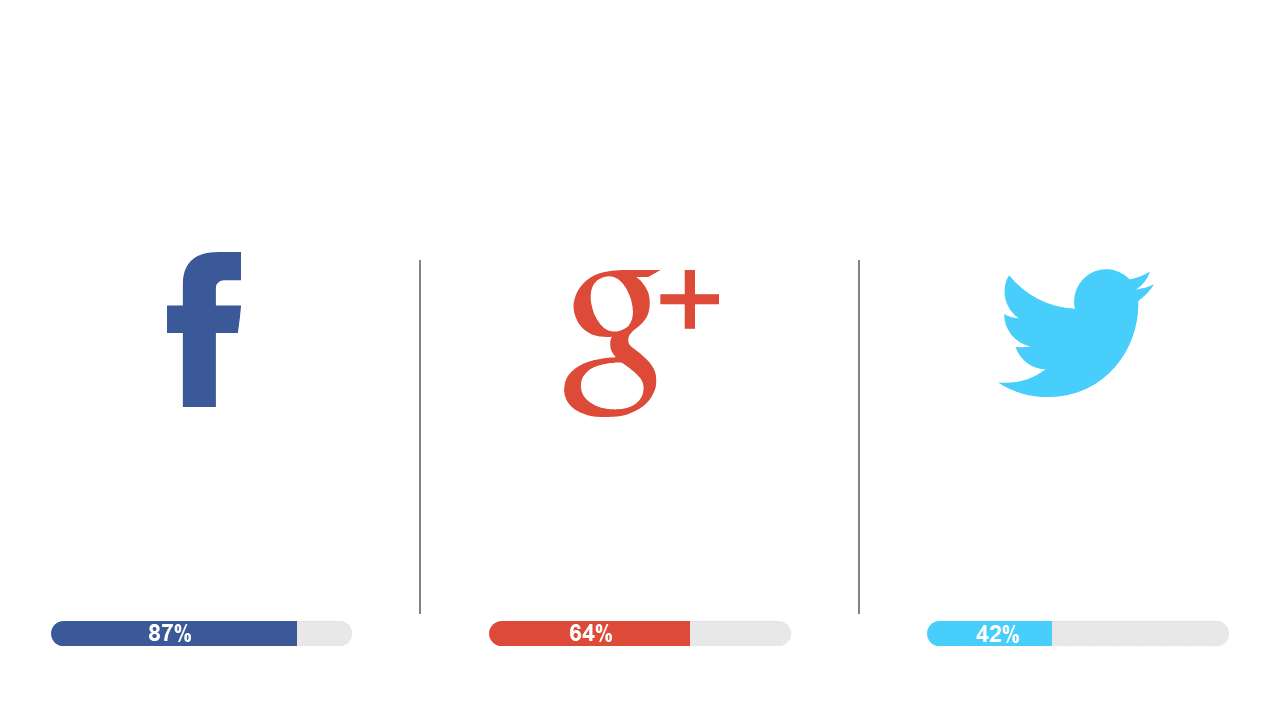
Communicating social media engagement metrics can be confusing without the right tools. This bar chart layout offers a clear and concise way to compare engagement across different platforms, making your data more digestible for your audience.
Say goodbye to convoluted charts that lead to misunderstandings. Ideal for marketers, business analysts, and project managers, this slide is perfect for presentations focused on performance metrics, marketing effectiveness, or strategy planning. Use it to provide a compelling comparison during review meetings or client discussions.
Available for just $0.99, this slide is ready for instant download and fully editable in both PowerPoint and Google Slides. Customize the labels and percentages effortlessly, and have your presentation polished and ready in minutes.
$0.99 – Purchase Checkout
Added to cart







