Present Social Media Engagement Metrics Clearly Style
Product Description
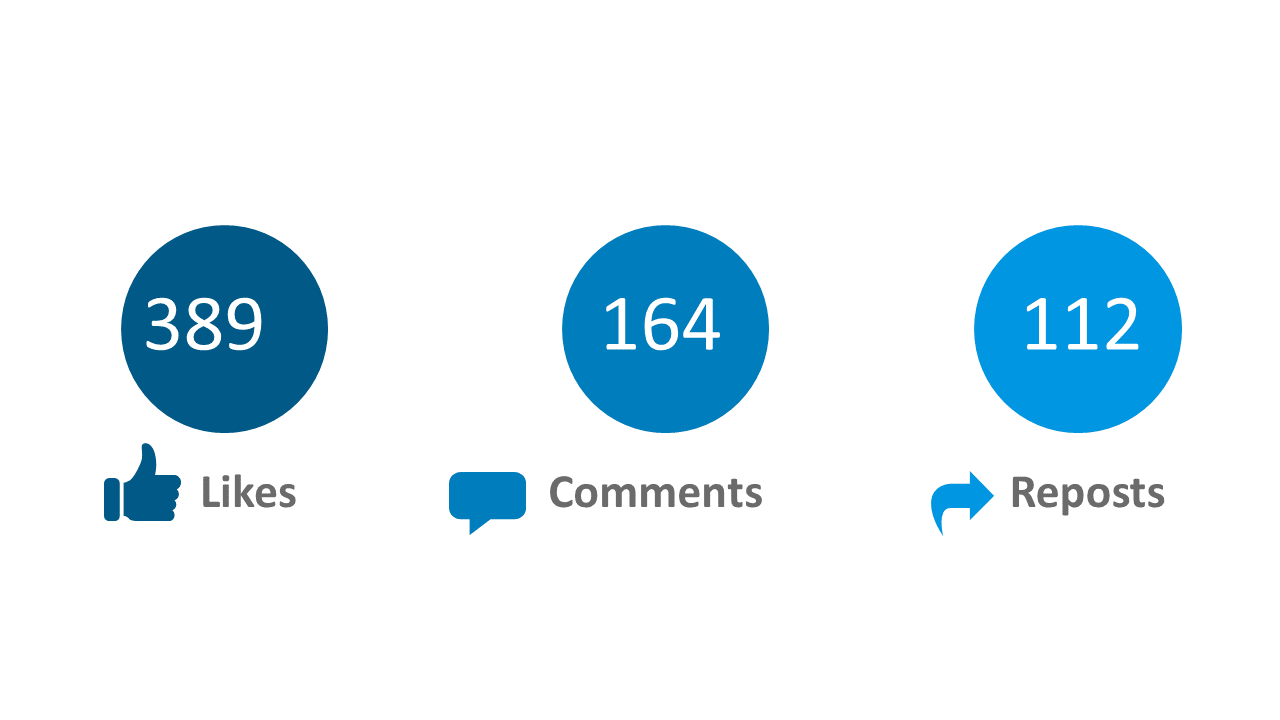
Presenting social media engagement metrics can quickly become overwhelming, especially when you have a lot of data to convey in a limited amount of time. This slide allows you to communicate essential metrics—like Likes, Comments, and Reposts—in a clean, organized fashion.
The circular icons make it easy for your audience to grasp your performance at a glance, simplifying what can otherwise feel like a barrage of information. Social media managers, marketing directors, and business analysts can use this slide in various contexts, such as during strategy meetings or in client reports. It’s a valuable tool for anyone needing to present a snapshot of how their social media efforts are performing, making discussions more productive and informed.
For just $0.99, this slide is available for instant download. It’s fully editable in both PowerPoint and Google Slides, allowing you to customize it to fit your specific data and style within minutes.
$0.99 – Purchase Checkout
Added to cart







