Analyze Shopping Cart Abandonment with Graphs
Product Description
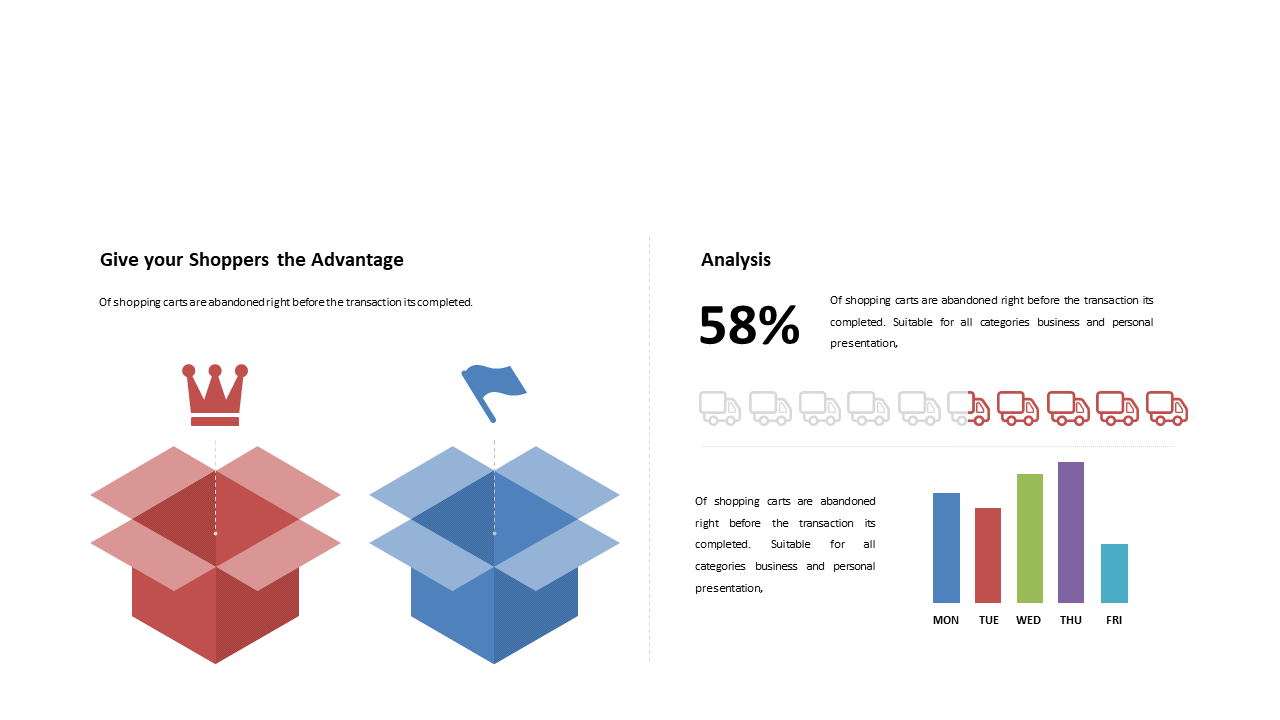
Understanding why customers abandon their shopping carts can feel mysterious, especially when trying to analyze the data behind the issue. This slide offers a straightforward, visual analysis of abandonment rates through engaging graphs and icons, transforming complex information into clear insights.
It allows you to present your findings in a way that resonates with your audience. E-commerce managers analyzing customer behavior, marketing teams strategizing to improve sales funnels, or analysts conducting research on consumer habits will find this slide invaluable. It turns intricate data into a narrative that’s easy to follow, helping stakeholders grasp the critical factors driving shopping cart abandonment.
For just $0.99, you can instantaneously download this slide. It’s fully editable in PowerPoint and Google Slides, making it simple to customize your graphs and visuals within minutes to suit your presentation needs.
$0.99 – Purchase Checkout
Added to cart







