Present Comparative Data with Semi-Circular Visuals
Product Description
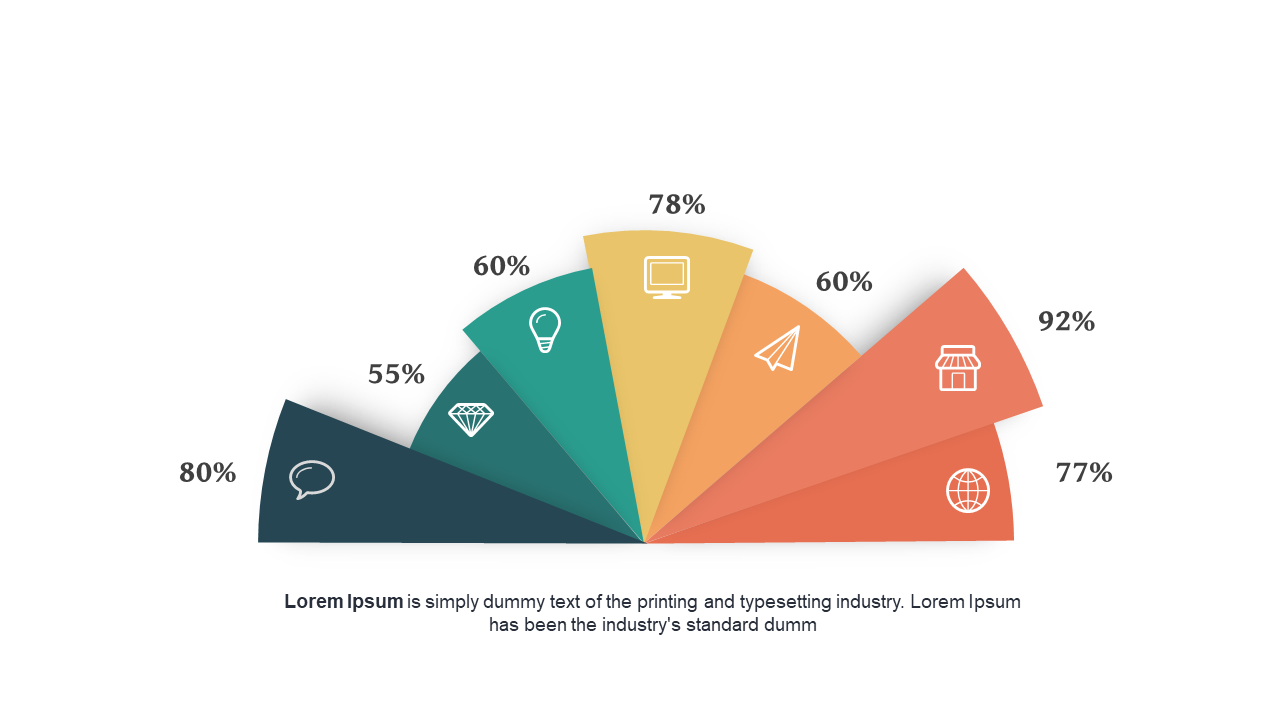
When you’re tasked with presenting comparative data, clarity is key. You need visuals that not only convey information but also engage your audience. This slide offers a semi-circular design divided into segments, each showcasing percentage indicators for easy understanding. It’s perfect for displaying survey results or performance metrics that require a quick visual comparison.
As a data analyst, you can use this slide to break down complex datasets into digestible visual pieces, making your analysis easier for your audience to grasp. A business analyst might find it invaluable for summarizing findings from market research or customer feedback, presenting insights in a compelling manner. For a BI developer, integrating this slide into reports can enhance the visual appeal of dashboards, making key metrics stand out.
Customization is straightforward; simply edit the colors to align with your branding or presentation theme.
$0.99 —
add this single slide to any deck from the SlideSwift Slide Library. No subscription needed. Mix slides from any category to build your perfect deck.
$0.99 – Purchase Checkout
Added to cart







