Visualize Data with Segmented Pie Charts
Product Description
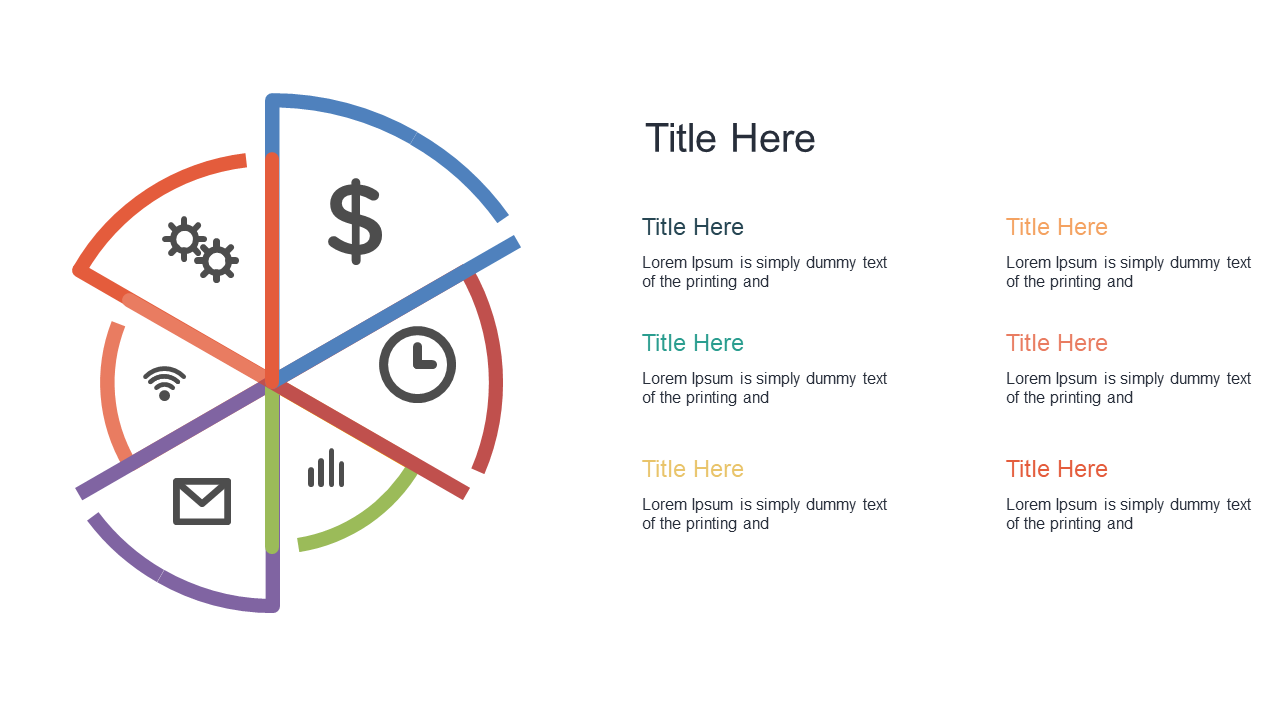
Communicating data-driven insights effectively can be a real hurdle, especially when the information is packed with metrics. This segmented pie chart slide makes it easy to visualize key performance indicators, presenting your data in a format that’s not only attractive but also simple to understand.
Data analysts, sales professionals reporting on quarterly performance, or finance teams discussing budget outcomes will find this slide invaluable. With accompanying icons, it highlights essential metrics clearly, making it perfect for any meeting where decisions depend on data clarity.
For only $0.99, you can download this slide immediately and edit it in PowerPoint or Google Slides. You’ll be able to customize it quickly and effectively, ensuring your visual data representation is ready in no time.
$0.99 – Purchase Checkout
Added to cart







