Present Sales Metrics with Engaging Infographic
Product Description
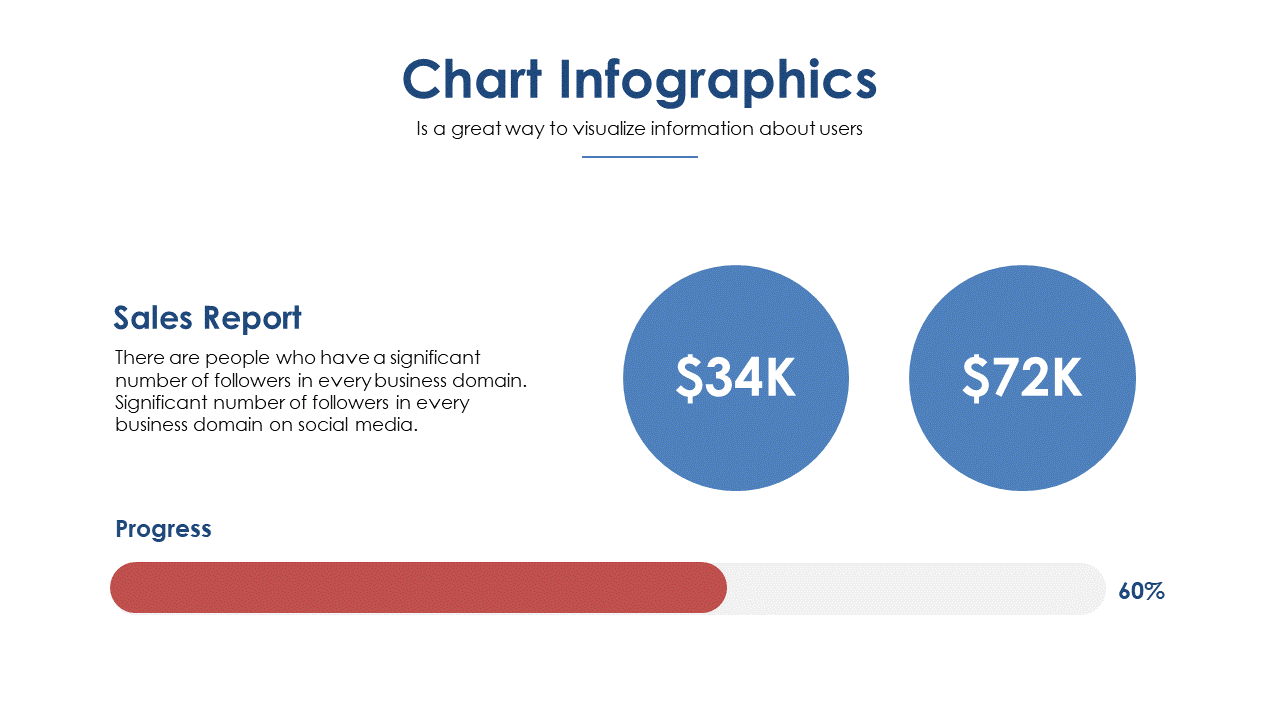
Communicating sales metrics effectively can be tricky, especially when you need to grab your audience’s attention quickly. This engaging infographic helps you turn numbers into a narrative, showcasing key figures alongside a dynamic progress bar that captivates viewers and drives your point home.
Sales executives, business analysts, and marketing professionals will find this slide useful in client meetings, performance reviews, and sales strategy discussions. It’s designed to make your data not just informative but also visually compelling, so you can keep your audience engaged and informed.
For only $0.99, you can download this slide immediately. It’s designed for easy editing in PowerPoint and Google Slides, allowing you to customize it to reflect your specific sales narrative within moments.
$0.99 – Purchase Checkout
Added to cart







