Visualize Hierarchical Data with Pyramid Chart
Product Description
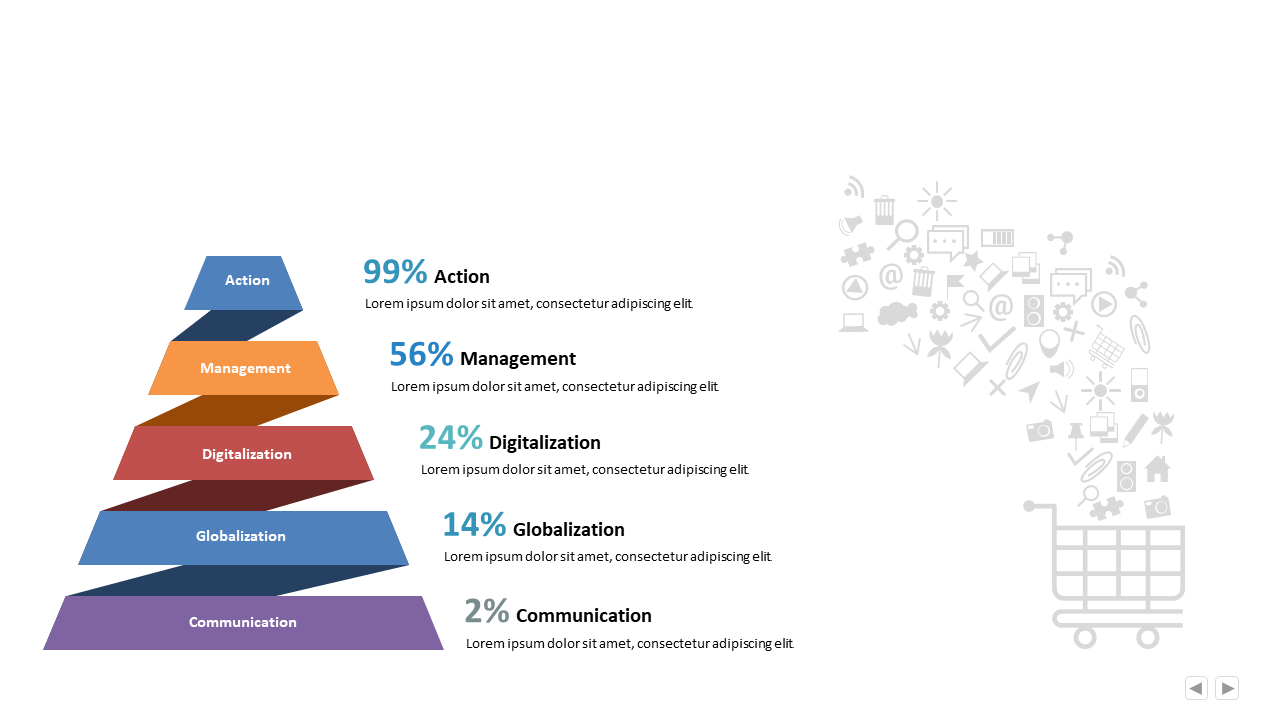
Finding a way to present complex hierarchical data can often leave you frustrated and anxious about audience engagement. This pyramid chart simplifies that task, allowing you to depict percentage distributions across categories clearly.
It’s a straightforward approach that provides a visual snapshot of important relationships at a glance. Business analysts, product managers, and marketing strategists will find this slide particularly useful during monthly reports, product launches, or team briefings. It’s great for showing how various elements fit together in a strategic overview, ensuring clarity for your audience.
Available for just $0.99, this slide is an instant download and is fully editable in PowerPoint or Google Slides. Customize your content in no time, making your data easy to understand and visually appealing.
$0.99 – Purchase Checkout
Added to cart







