Visualize Data Distribution with Pie Chart
Product Description
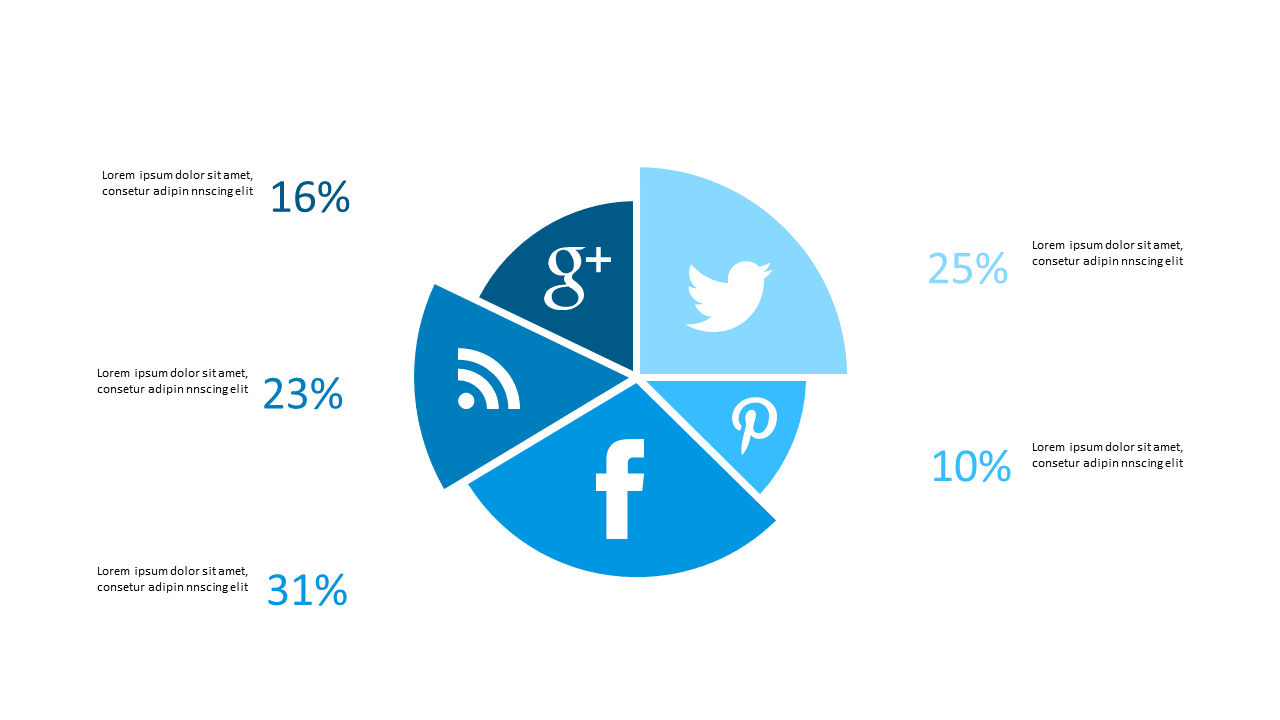
In fast-paced work environments, clarity in data presentation is key for informed decision-making. When you need to represent data distribution effectively, a pie chart can be the visual solution you’re looking for.
This slide allows you to illustrate complex data simply and effectively, ensuring your audience quickly understands the key segments. Data analysts, project managers, and business developers will find this slide useful during team briefings, strategy meetings, or client discussions. It provides an intuitive way to present detailed information, making it easier for everyone to absorb and act on the insights shared.
Available for just $0.99, this slide is ready for instant download and is easily editable in PowerPoint or Google Slides. You’ll be able to customize it and have your presentation ready in just minutes.
$0.99 – Purchase Checkout
Added to cart







