Visualize Key Pharmacy Metrics Effectively
Product Description
Presenting key pharmacy metrics can often fall flat if the visuals aren’t straightforward. You want to deliver information that resonates but can often struggle with how to visualize data effectively.
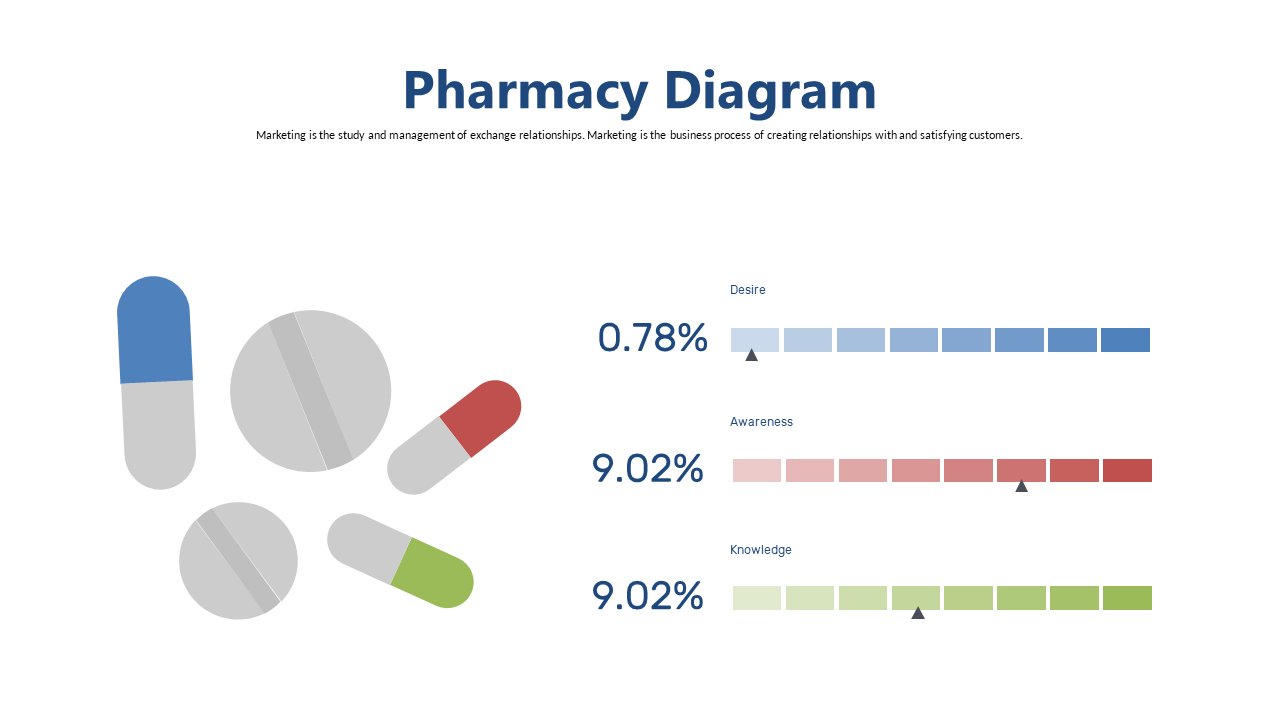
This pharmacy-themed diagram is designed to succinctly showcase vital metrics in a way that captures attention and conveys your points clearly. Use this slide to support your data-driven discussions in roles such as pharmacy directors, marketing analysts, or financial advisors during performance reviews or strategic planning meetings. It’s perfect for highlighting trends and insights that are critical to understanding business performance in the pharmacy sector.
For only $0.99, this slide is available for instant download and ready for editing in both PowerPoint and Google Slides. It allows for easy modifications, so you can personalize it to suit your specific audience.
$0.99 – Purchase Checkout
Added to cart







