Showcase Pharmacy Metrics with Customizable Diagram V2
Product Description
Finding a clear way to express complex pharmacy metrics often hinders effective communication. You need a presentation tool that helps bridge the gap between data and understanding without overwhelming your audience.
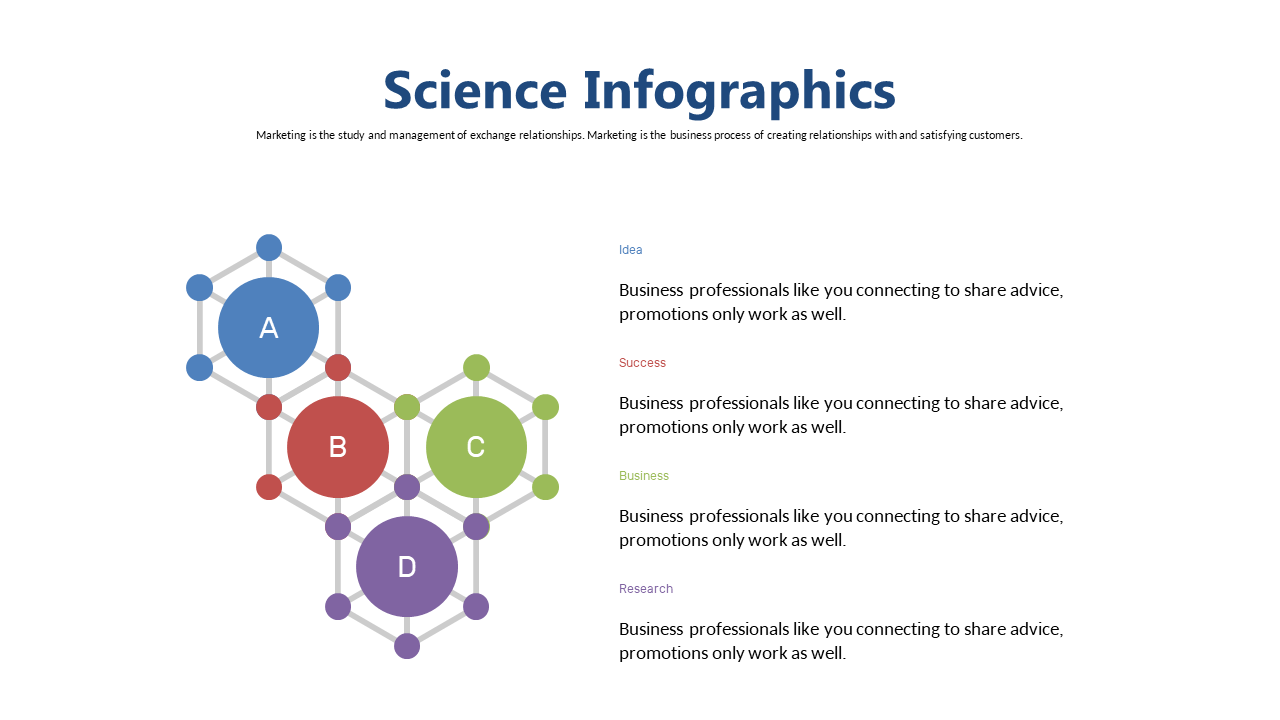
This customizable pharmacy-themed diagram is tailored to highlight essential metrics in a visually appealing way. This slide is ideal for data analysts, pharmacy operations managers, and consultants who frequently present findings to executives or team members. Whether you’re discussing quarterly results or strategic initiatives, the design enables you to convey critical metrics without losing your audience’s attention.
Offered at just $0.99, this slide is ready for immediate download and is easily editable in PowerPoint and Google Slides. You can make the necessary adjustments within minutes to ensure it fits seamlessly into your presentation.
$0.99 – Purchase Checkout
Added to cart







