Visualize Personal Metrics with a Bar Chart
Product Description
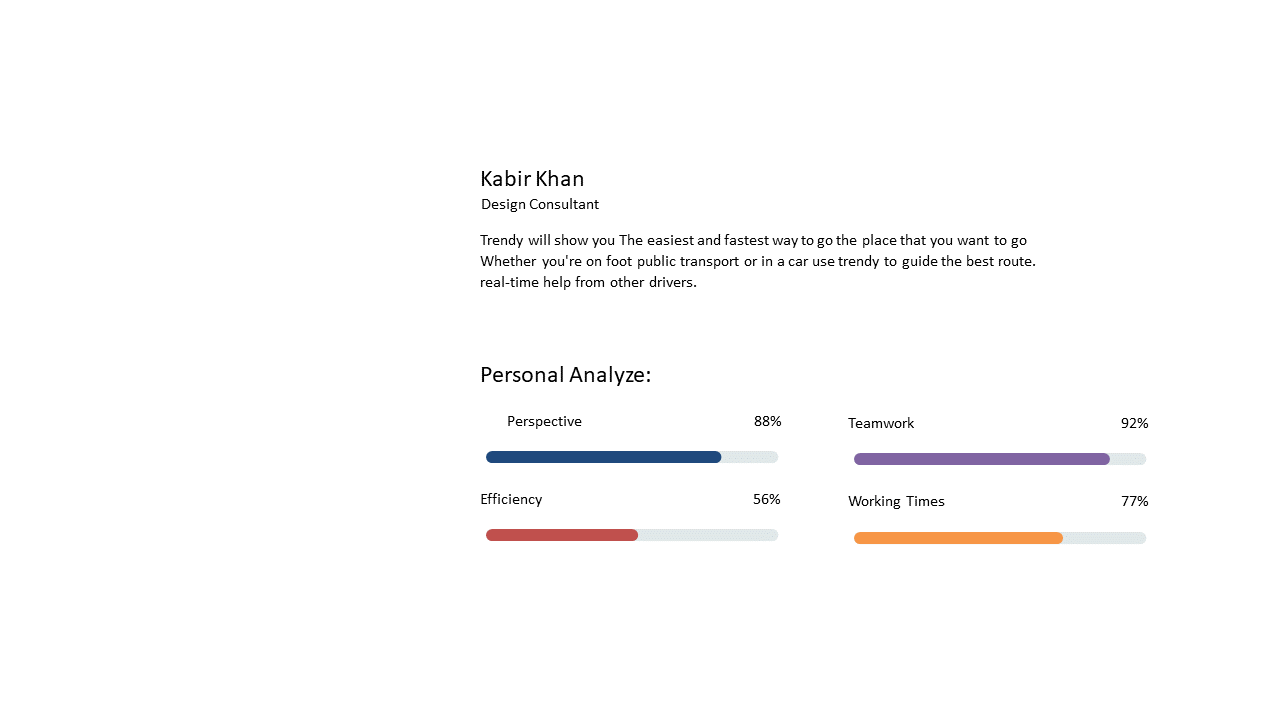
In our data-centric environment, effectively showcasing personal metrics can be a hurdle for many. This slide features a streamlined bar chart that highlights key performance indicators, allowing you to visually communicate essential information like teamwork and efficiency.
Ideal for analysts presenting results in quarterly reviews, consultants sharing findings with clients, or team leaders discussing performance with their groups, this slide fits various roles and scenarios. It makes complex data straightforward, transforming numbers into a narrative that everyone can understand.
Available for just $0.99, this slide is ready for immediate download and customization. You can easily edit it in PowerPoint or Google Slides, giving you a simple way to enhance your presentations right away.
$0.99 – Purchase Checkout
Added to cart







