Visualize Key Statistics with Silhouette
Product Description
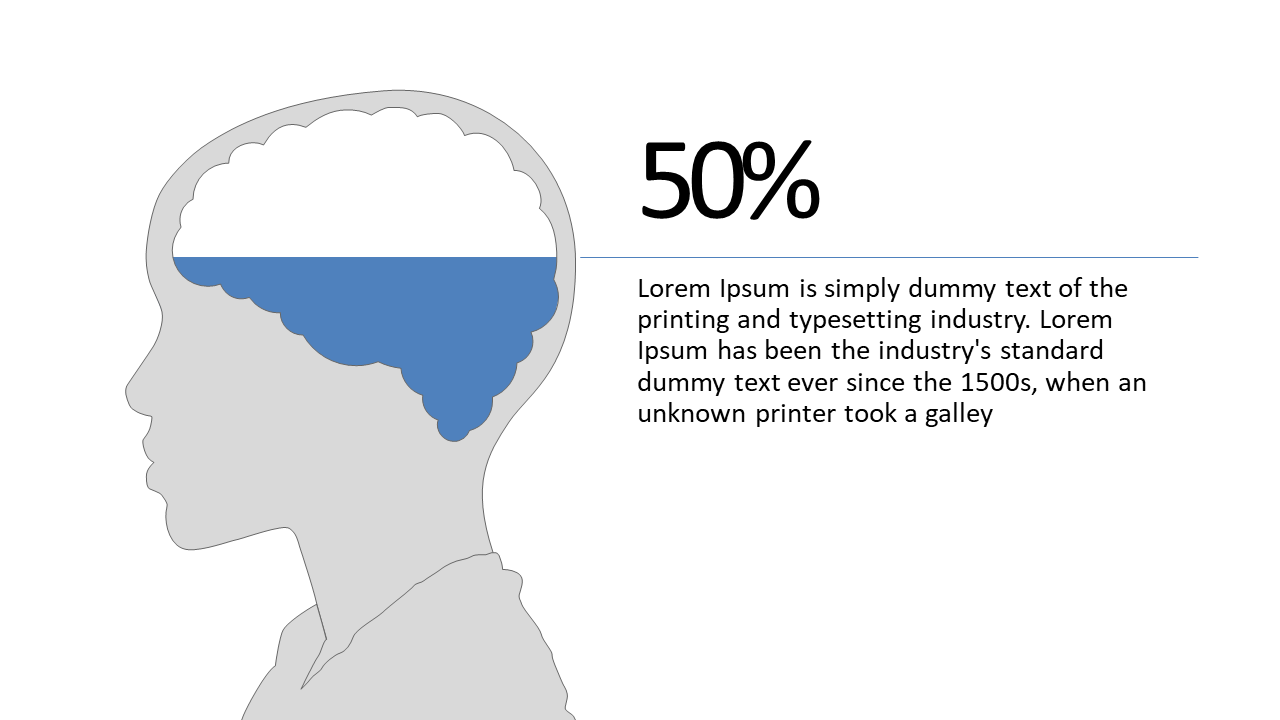
As a data analyst, turning complex statistics into something engaging can feel daunting. You need a way to present these figures that grabs attention without overwhelming your audience. This slide features a striking silhouette integrated with a percentage graphic, designed to make key statistics not just understandable, but memorable.
Data professionals, business analysts, and marketers can use this slide in a variety of contexts. Whether you’re presenting quarterly reports, market research findings, or sales performance metrics, this slide helps bring clarity to your data during presentations and discussions.
It’s perfect for board meetings or client pitches where impactful visuals can make a difference. Available for just $0.99, this slide is a quick download that you can edit in PowerPoint and Google Slides. Get your presentation ready in minutes, so you can focus on delivering your insights.
$0.99 – Purchase Checkout
Added to cart







