Present Percentage Progress Clearly in PowerPoint
Product Description
Communicating percentage progress can be a headache, especially when you want your audience to grasp key information at a glance. Many professionals struggle to present numbers in a way that resonates, leading to confusion and disengagement.
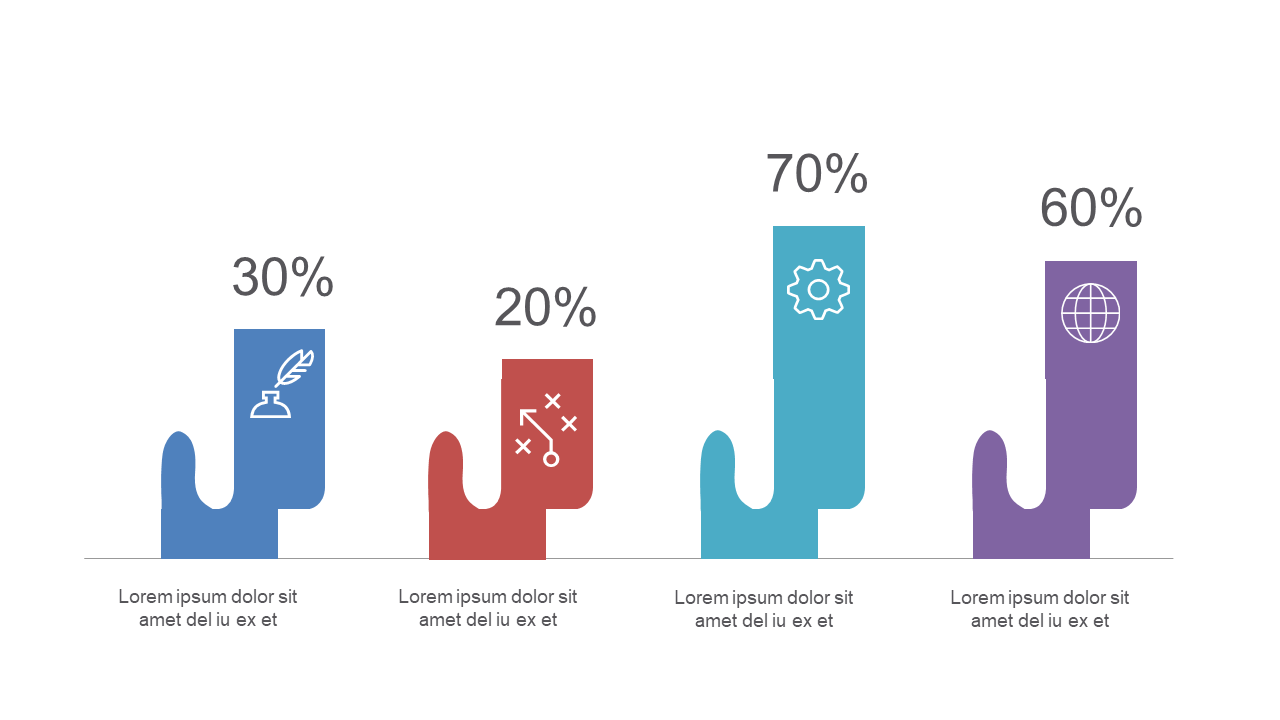
This slide solves that problem with visually striking percentage progress bars that capture attention and convey information clearly. Marketing managers tracking campaign performance, project managers updating teams on project milestones, or sales leads reporting on quarterly goals will find this slide particularly useful. Whether you’re in a weekly team meeting or a quarterly review, this slide ensures your audience stays engaged and understands your progress at a glance.
For just $0.99, you can instantly download this slide, which is fully editable in both PowerPoint and Google Slides. It’s designed for quick customization, so you can present your data effectively in no time.
$0.99 – Purchase Checkout
Added to cart







