Present Geographic Data with World Map Distribution
Product Description
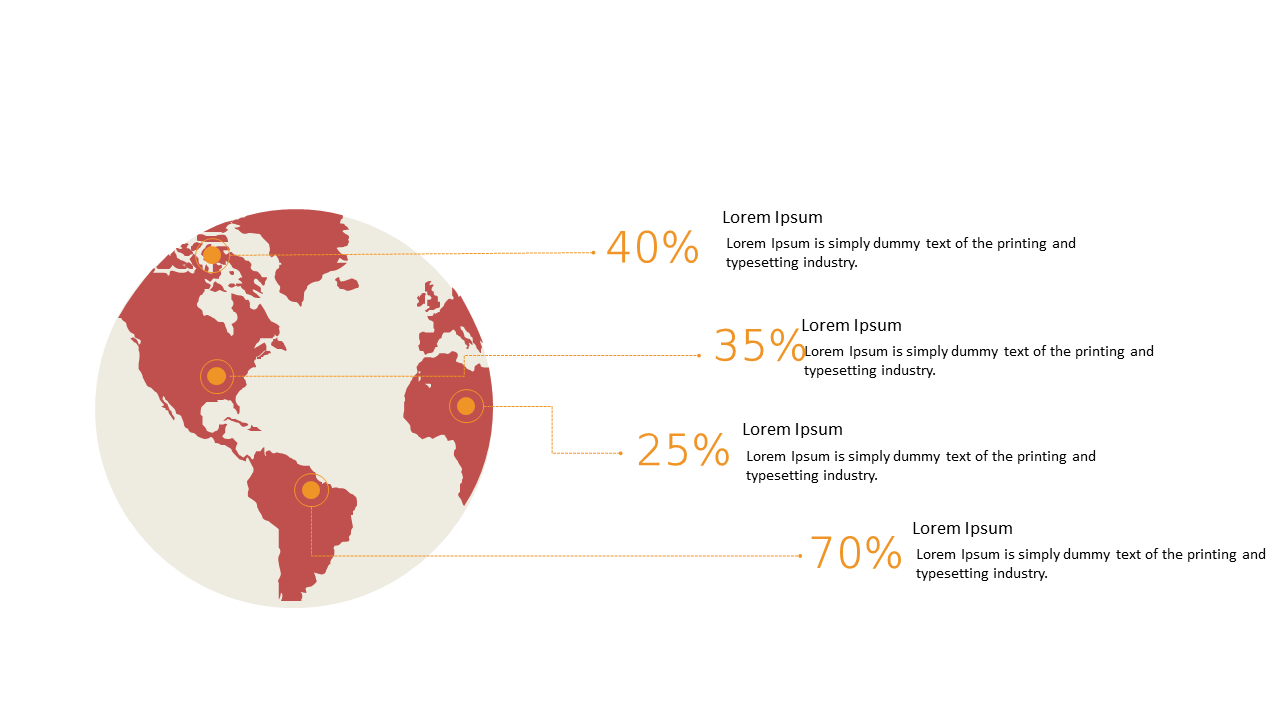
Effectively presenting geographic data can be a challenge, particularly when it encompasses complex market shares or demographic statistics. If you find it hard to communicate this information clearly, this world map distribution slide provides a visually engaging way to highlight essential data across different regions.
Market analysts, business development managers, and regional sales directors will find this slide invaluable when discussing market trends, growth opportunities, or competitive landscape analysis. It’s ideal for international sales meetings, strategic planning sessions, or research presentations where geographical data plays a crucial role.
For only $0.99, you can download this slide immediately and customize it effortlessly in PowerPoint or Google Slides. Editing is simple, ensuring that you can adapt the content to suit your specific context in no time.
$0.99 – Purchase Checkout
Added to cart







