Present Progress with Circular Percentage Indicators
Product Description
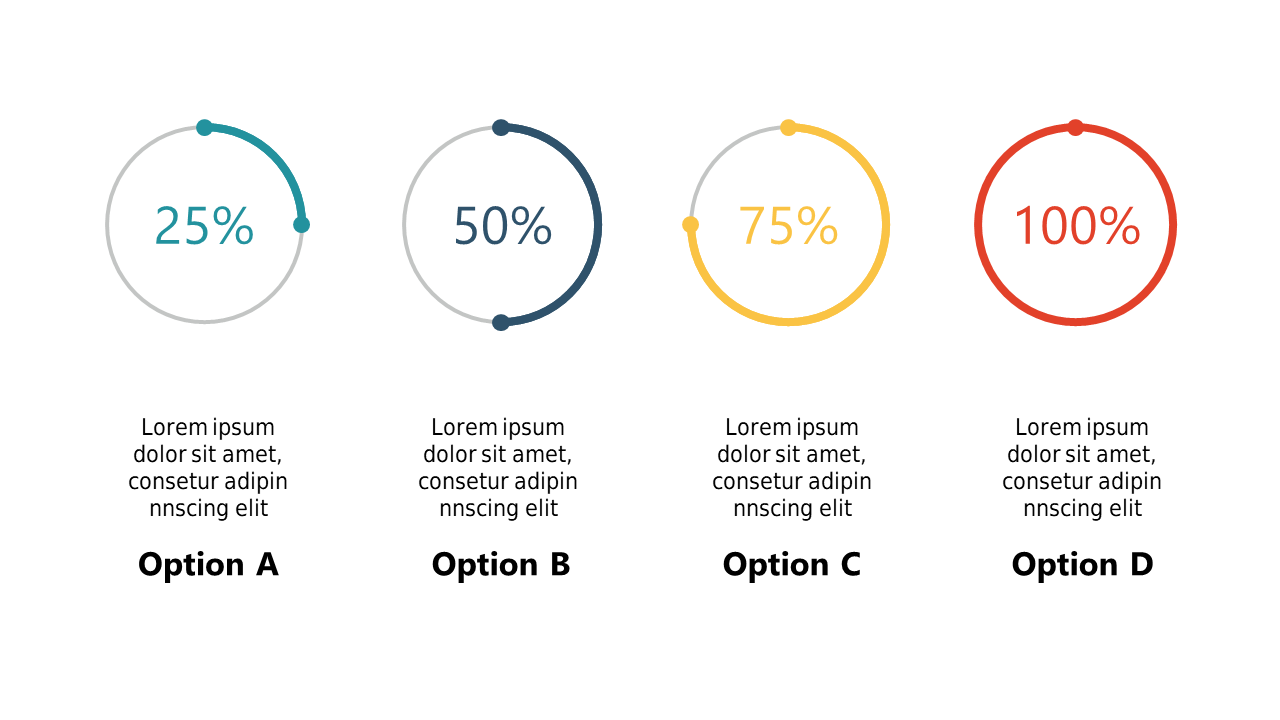
Communicating progress can be tricky, especially when you have to keep your audience engaged. This slide comes with circular percentage indicators that transform dull statistics into visually appealing visuals, making it easier to convey completion rates and project milestones clearly.
Data analysts at tech companies, project managers reviewing timelines, and team leaders tracking objectives will all benefit from this visual tool. Use it in status update meetings or project reviews where you’re highlighting team performance or project completion. The eye-catching design ensures that everyone stays focused on the essential information.
For only $0.99, this slide is available for instant download and is easy to edit in both PowerPoint and Google Slides. Get it now and enhance your presentations in no time.
$0.99 – Purchase Checkout
Added to cart







