Visualize Survey Comparisons with Icon Percentages
Product Description
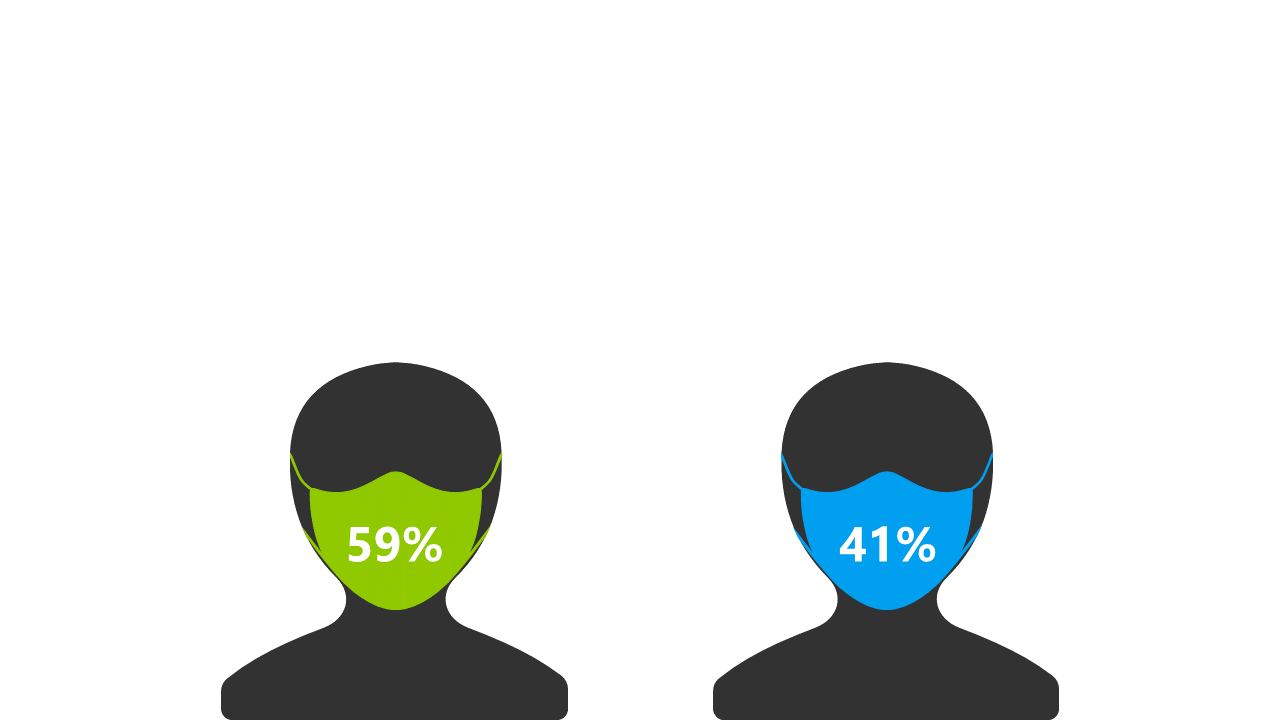
Presenting survey comparisons can often be a challenge, especially when visuals fail to capture your audience’s attention. Confusing statistics can lead to misunderstandings, and you want your message to be clear and direct. This layout, featuring two icons with percentage values on masks, is designed to effectively visualize survey results and enhance comprehension.
Data analysts, marketing professionals, and project managers will find this slide indispensable when comparing results from market research or client surveys. It’s perfect for presentations in boardrooms or during client meetings, where clear visual representation of data is essential to driving home your points.
This layout ensures your audience can easily follow along and understand the comparisons being made. At just $0.99, you can instantly download this slide and make it your own. It’s fully editable in PowerPoint and Google Slides, allowing you to customize the visuals and percentages quickly, so you can focus on delivering your message with confidence in no time.
$0.99 – Purchase Checkout
Added to cart







