Engage Audiences with Circular Progress Indicators
Product Description
Translating intricate financial data into understandable visuals can often feel like an uphill battle. If your audience struggles to grasp key metrics quickly, you need a way to present information that captures attention without confusion.
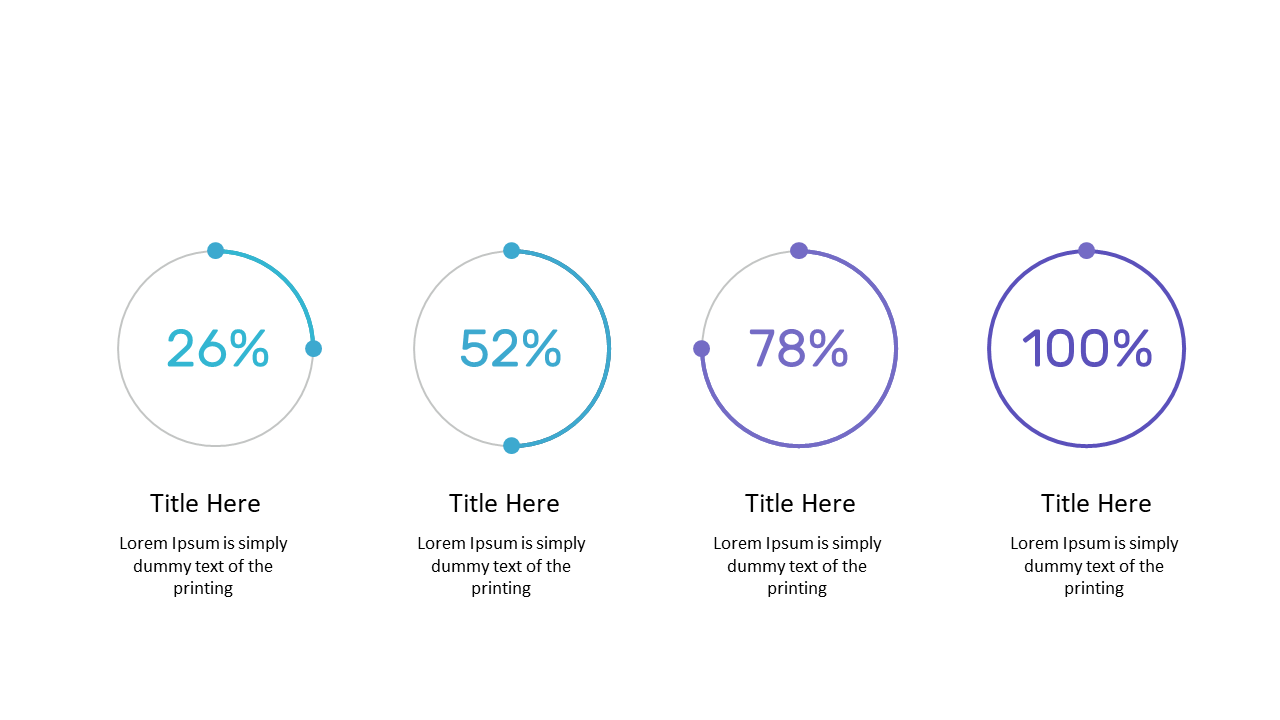
This slide features circular progress indicators that make percentages visually accessible and easy to comprehend. This slide is perfect for financial analysts, business consultants, or project managers who need to present quarterly reports, budget proposals, or performance metrics. Whether you’re in a board meeting, a client briefing, or a team review, this visual tool enhances your ability to convey essential data effectively.
Available for only $0.99, this slide is ready for instant download and can be customized in PowerPoint or Google Slides. Edit it effortlessly to match your data and make your next presentation impactful.
$0.99 – Purchase Checkout
Added to cart







